

 LinkedIn

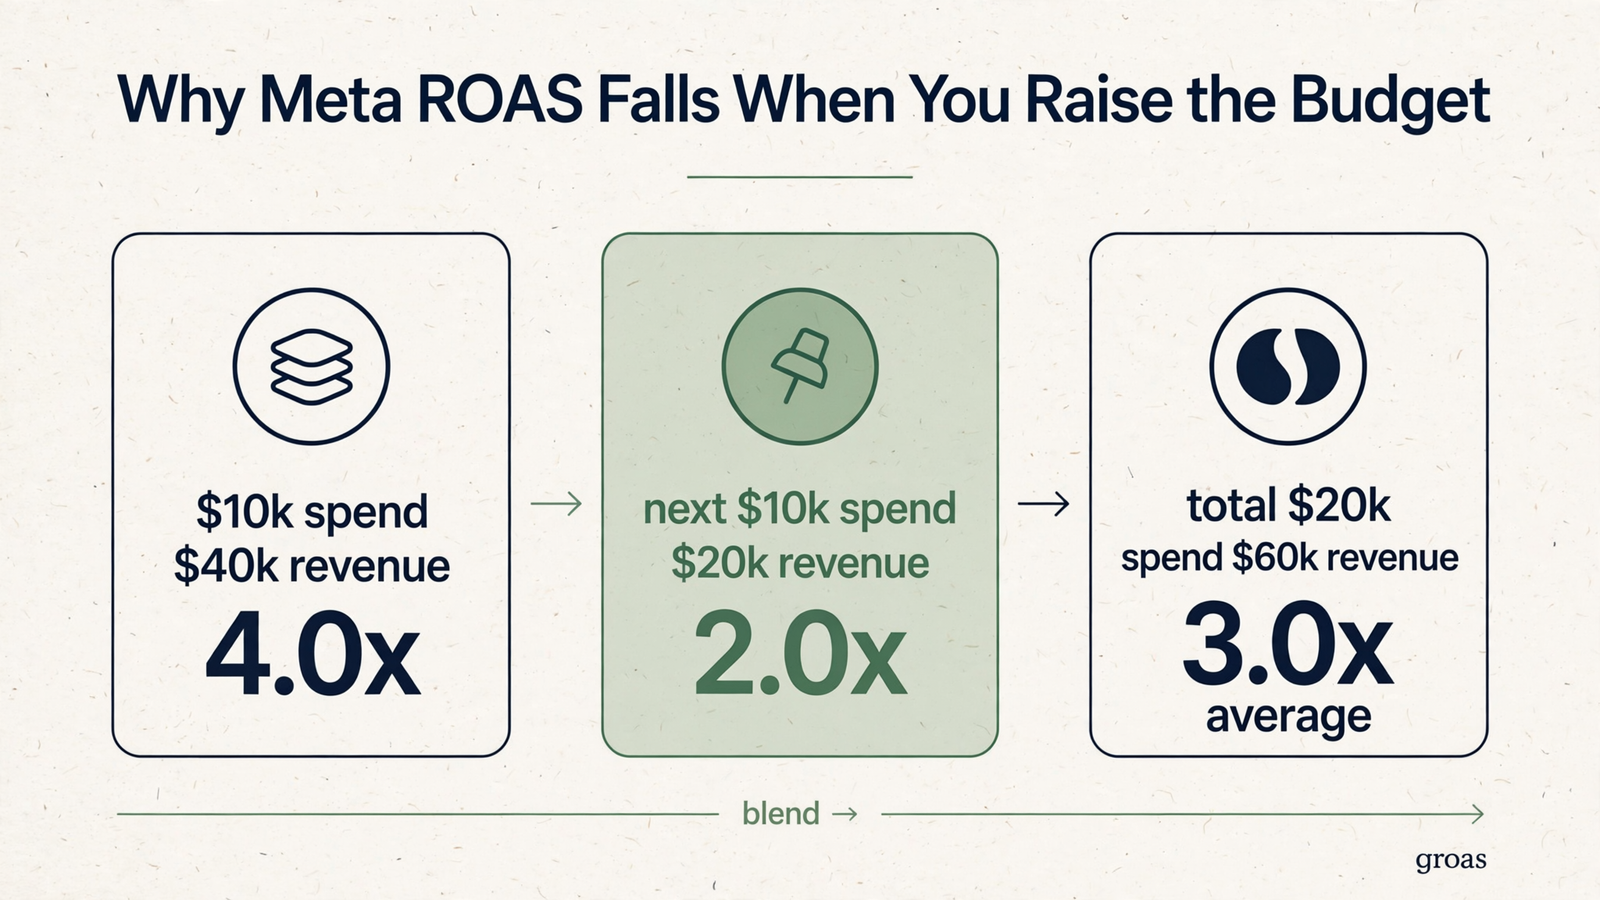
You spend $10,000 on Meta ads in a week and get $40,000 back: 4x ROAS. You double the budget, expecting $80,000, and get $60,000 instead. Average ROAS falls to 3x. That does not mean the scale-up failed.
The first $10,000 returned $40,000. The next $10,000 returned another $20,000: 2x marginal ROAS. Meta had already spent against the easiest buyers it could find, so the extra budget had to reach the next-easiest ones. I used to tell clients that a good manager should hold average ROAS flat while scaling. I was wrong. As long as the first dollars reach the cheapest conversions, spending more pushes the average down. The useful question is whether the next dollars still clear break-even.
Why the next buyer costs more
Meta does not simply sell an impression to the highest bidder. Its total value auction considers bid, estimated action rate, and ad quality. Estimated action rate is Meta’s prediction that this person will do what you asked. Ad quality reflects its assessment of the ad itself, including whether showing it is likely to be a poor experience.
That gives creative two jobs. It needs to persuade the person who sees it, and it needs to give the auction a reason to show it. With ad quality held equal, a $5 bid at a 3% predicted conversion rate can outrank a $15 bid at 0.8%. The larger bid does not automatically win. If your predicted rate and quality stay weak, raising the bid cannot turn an indifferent audience into eager buyers.
The cheapest conversions go first
At a lower budget, delivery can concentrate on people Meta expects to convert at a relatively low cost. Raise the budget and it needs more opportunities. Some of those people take more impressions to persuade, cost more to reach, or buy at a lower value. The extra revenue may still exceed the extra spend, but the average ROAS can fall as the next conversions get more expensive.
Think of the $10,000 week as the first stretch of that curve, not a price tag Meta promises to honor on every additional buyer. This is where the shelf analogy helps: taking the inexpensive jars from the front does not make the jars behind them cheaper. The analogy stops there. Buyers are not fixed jars on a shelf; creative, audience, signals, and auction conditions can change which opportunities are available. First measure the next dollars. Then decide whether you need to change the curve.
Average ROAS reports the blend; marginal ROAS prices the decision
Average ROAS is total revenue divided by total spend. Marginal ROAS is the additional revenue divided by the additional spend. The first tells you how the account performed overall. The second tells you what your scale-up bought.
Use the two weeks from the opening:
- Before: $10,000 in spend produces $40,000 in revenue, or 4.0x average ROAS.
- After: $20,000 in spend produces $60,000 in revenue, or 3.0x average ROAS.
- Increment: The extra $10,000 produces the extra $20,000. That is 2.0x marginal ROAS.
Nothing in that calculation says the whole $20,000 performed at 2x. Nor does the 3x account average tell you that the new $10,000 performed at 3x. The average blends the old dollars and the new dollars, which is exactly why it can hide a bad scale decision.
The same distinction works for purchases. If $100 a day buys five orders, average CPA is $20. If $200 buys eight orders, average CPA rises to $25. But the extra $100 bought only three extra orders, so marginal CPA is about $33. You can be comfortable with a $25 account average and still need to ask whether those last three orders were worth $33 each.
Suppose your margin is 40%, making break-even ROAS 2.5x. A 3.0x average that conceals a 2.0x marginal return is not permission to keep scaling. Compare marginal ROAS with break-even, not average ROAS with last week’s average.
Give a budget change time to show its work
A falling average may be ordinary marginal arithmetic. A sharp change right after a large budget increase can also be hard to read for two more reasons.
First, a large jump can push an ad set back into learning. Meta needs around 50 optimization events a week to exit that phase. That is the case for the unglamorous advice to raise budgets in steps of around 20%: it gives delivery a chance to adapt rather than asking it to absorb the whole jump overnight. It does not guarantee stable results. It makes the next result easier to interpret.
Second, spend arrives in the report before every resulting purchase does. Under a 7-day click and 1-day view attribution window, a sale can be credited back to the earlier ad interaction. Look two days after a budget increase and you may be comparing spend that has appeared with revenue that has not yet arrived. I wait for a full window before treating a dip as real.
That does not mean every dip will disappear if you wait. It means the first two days cannot settle the argument. Take a smaller step, allow the window to mature, then compare what the extra spend bought. The cheapest-first logic behind rising Facebook CPL applies here too; ROAS just expresses the result in revenue rather than leads.
Change the curve, not just the budget
Marginal returns explain why scaling gets harder. They do not excuse every decline. If the next dollars stop paying, look for what changed before you replace the creative or fire the manager.
Creative fatigue has a pattern worth watching: frequency rises, link click-through rate falls, CPM rises, and ROAS may drop one to three weeks later. For prospecting, I start watching when frequency moves above 2.5 and get more concerned above 3.5. I also compare click-through with the first two weeks for a drop of 20% or more, and watch for CPM climbing 15% or more. In one documented fatigue example, frequency went from 1.4 to 3.8, click-through from 1.40% to 0.80%, and ROAS from 2.25x to 1.07x over five weeks. The sequence matters more than any one threshold.
The remedy depends on the pattern:
- One ad falls while others hold: Suspect creative fatigue. Refresh that ad rather than rebuilding everything around it.
- All ads fall while reach stays flat despite more spend: Suspect audience saturation. Widen the pool before buying more of the same reach.
- CPM rises even on fresh ads while click-through holds: Consider seasonal auction pressure. New creative alone may not solve a pricier auction.
That fatigue, saturation, and seasonality distinction is easy to lose in a postmortem that starts and ends with “ROAS went down.” The diagnosis should name what moved before it prescribes what to change.
Widening the pool can give delivery new buyers to find. A practical structure for that work is one broad or Advantage+ Shopping campaign for scale, one testing campaign, and one retargeting campaign. The 2026 scaling playbook pairs increases of 15 to 30% every two to three days with 8 to 15 new creative variants a week. Those are operating choices, not a promise that every account can sustain that pace. Meta reports around 22% higher ROAS and 12% lower CPA from Advantage+ Shopping; the same playbook warns that weak Conversions API implementation can leave reported ROAS understating true ROAS by 20 to 40%. I want event match quality above 7 or 8 before I put much faith in the reported number.
Your creative is your targeting now: a new angle can qualify a different part of that broad audience. That is a way to find a better next buyer, not a way to make the marginal-return problem vanish.

Then inspect what the bidder is learning. Max conversions looks for conversions; value optimization bids toward predicted conversion value. Meta cites around 12% higher ROAS versus max conversions for advertisers that supply the values it needs. The value optimization requirements matter more than the headline: purchase value on every event through Pixel plus Conversions API, 30 to 50 purchases a week with at least five distinct values, and creative that does not teach the system to chase only discount buyers. If purchase values are missing or flat, the bidder cannot distinguish a high-value order from a low-value one. Better signals can change which buyers the next dollars pursue.
Tell an expected drop from a fault
An expected drop looks like this: spend goes from $10,000 to $12,000, average ROAS goes from 4.0x to 3.7x, and the extra spend returns 2.8x. With 2.5x break-even at a 40% margin, those next dollars still clear the bar. Frequency and click-through are flat. Let the attribution window finish before making the call, but do not demand that the 4.0x average return.
A fault gives you a different reason to act. Marginal ROAS remains below break-even after the window matures. Or ROAS falls while spend stays flat, so added budget cannot explain the change. Or someone doubles the budget in a day, delivery relearns, and they diagnose the next 48 hours of noisy data as a creative failure. In each case, the next question is specific: Is the problem the cost of reaching another buyer, fatigue, the auction, or the signal used to value a purchase?
If mature marginal ROAS clears break-even, the falling average alone is not a fault. If it does not, stop treating the average as reassurance and investigate.
What I want a ROAS-focused manager to do each week
A manager who promises to “focus on ROAS” without discussing marginal ROAS is watching the wrong number. I want a routine that makes the next budget decision legible:
- Take a completed seven-day period after its attribution window has had time to mature. Compare it with a like-for-like earlier period at the lower spend level.
- Subtract earlier spend from later spend, and earlier revenue from later revenue. Divide the revenue difference by the spend difference.
- Compare that marginal ROAS with break-even: 1 divided by your margin. Then check whether creative, reach, frequency, and tracking changed enough to complicate the comparison.
- If the next dollars clear break-even, consider the next measured budget step. If they do not, work on the curve before adding spend.
This is not a claim that subtracting two weeks isolates budget perfectly. Conditions can change between them. It is a more useful starting point than celebrating an account average while the last dollars lose money. The levers behind the ROAS equation include conversion rate, average order value, and signal quality. A manager should be able to say which one they worked on, not just which budget button they pressed.
The rest of the week is curve work: ship and assess creative, watch prospecting frequency, and fix tracking before arguing over performance. Missing purchase values make reported ROAS harder to trust and give value bidding less to work with. That is the standard I would apply to any manager, and the reason I prefer groas’s emphasis on continuous execution and accountable decisions over paying for more dashboard time. Whatever the platform, the budget move needs a reason tied to the next dollars.
Now take a skincare store spending $5,000 a week and getting $25,000 back: 5.0x. Its founder wants to spend $15,000 next week and keep 5.0x. Start with the first principle. The original $5,000 reached the easiest buyers available under those conditions; another $10,000 cannot simply be assigned the same return.
Try a $1,000 increase instead, a 20% step. Say that extra $1,000 brings back $3,000. Marginal ROAS is 3.0x. Total revenue becomes $28,000 on $6,000 of spend, or about 4.7x average. The average fell. The step still paid. At a 50% margin, the store breaks even at 2.0x, so 3.0x marginal clears the bar.
That permits the next measured step to $7,200, not an automatic leap to $15,000. Let a full window mature and run the calculation again. Keep stepping while the next dollars clear 2.0x; stop if a full-window marginal reading falls below it, and check what happened to frequency, click-through, and tracking before deciding why. The falling average never made that call. The marginal number did.
So when you interview a Meta manager who promises to improve ROAS, ask how they price the next $1,000. If they only promise to hold the account average flat, they will fight the arithmetic instead of managing it. The manager you want can show the window used, compare marginal return with break-even, and name what they did to the curve that week. Average ROAS reports the score. Marginal ROAS decides the next move.