

 LinkedIn

Most AI search tools sell you a better view of your own absence. You pay a monthly fee, paste in twenty prompts, and get a dial showing 18% visibility or a line graph sliding downward between Tuesday and Thursday. The sales rep calls it your AI Visibility Score. I call it a bill for watching someone else take your customers.
I know this trick. For years, I watched clients fixate on Google Ads Quality Score while their cost per acquisition went nowhere. Agencies could show them a rising number, explain that the auctions were complicated, and send the next invoice. Now the same move has a new vocabulary: Share of Model, AI Visibility Index, Sentiment Trend. Automating the report automates the cheapest part of the job. The work that might get you cited stays undone.
A benchmark of 40 AI visibility tracking tools found prices from $20 to $3,000 per month, averaging $328.90. For that money, a tool may ping language models across a set of prompts and chart whether your brand appears. Useful observation, perhaps. Not marketing execution. It is a thermometer that charges you rent while you freeze.
The demo ends with a dial, not a plan
You know the demo. An account executive shares a dark-mode dashboard, enters a few category prompts, and clicks run. Your brand appears at 14%; a competitor glows at 62%. The rep pauses long enough for everyone to absorb the diagnosis. Then comes the offer: for $499 a month, their tier will check the models every night, chart the results across four surfaces, and email leadership a branded PDF each Monday.
You sign up. For two weeks, the team opens the tab with its morning coffee. On Tuesday, visibility rises from 14% to 19%; Slack emojis follow. On Thursday, it falls to 9%. Was it a model change? A search update? Something the competitor published? The chart cannot tell you what to change on your site, let alone change it. Practitioners on r/SEO have voiced the same frustration: the numbers wobble, but the buyer still has no operational lever to pull.
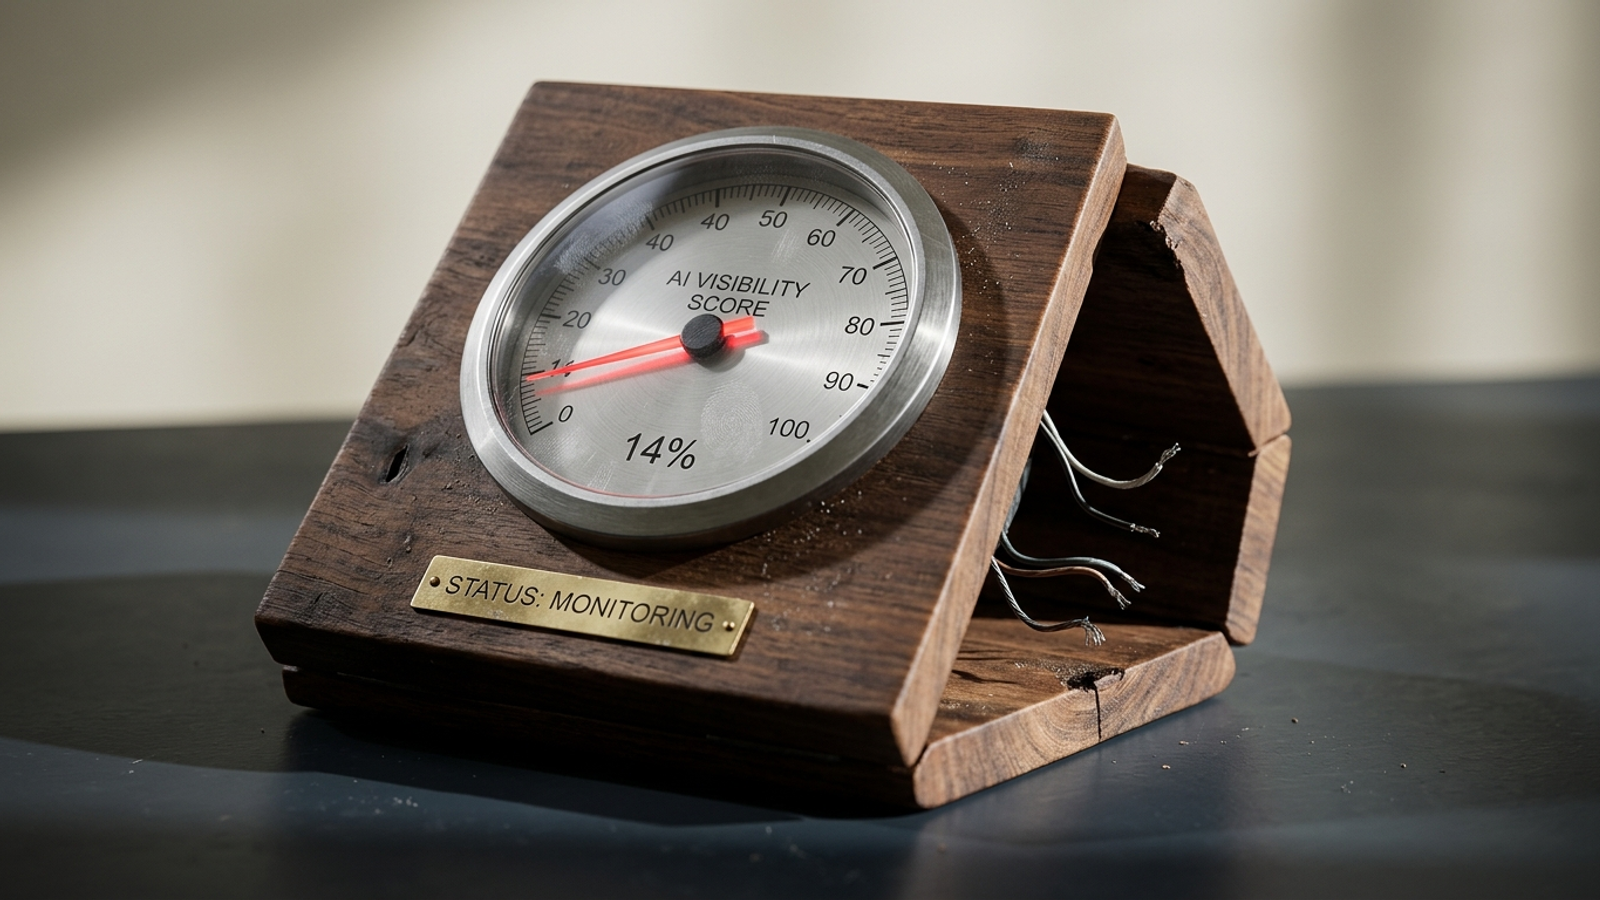
That is the monitoring business model’s neatest trick: it treats observation as progress. Each new report gives the team something to discuss, even when the discussion ends exactly where the last one did. A metric can tell you where to look. It cannot repair a page, publish a useful answer, or make your brand worth citing. You have bought a speedometer for a car with no engine.
I already watched this happen to Quality Score
In the mid-2010s, paid search teams built single-keyword ad groups and rewrote headlines to nudge Quality Score from 6/10 to 8/10. The routine was familiar: put the keyword in Headline 1, repeat it in Headline 2, squeeze it into the display path, mirror it on the landing page. Hope the number improves. Experienced operators knew Quality Score was a diagnostic, not a commercial result. You could polish a score to 10/10 and still pay for clicks that never became customers.
I watched clients celebrate the score while CPA sat still. I understood why the work was tempting: it was specific, measurable, and easy to put in a status report. When a client asked why acquisition costs had climbed, an agency could point to improved ad relevance across four campaigns. The chart was real. It just answered a cheaper question than the one the client had asked. The harder question was what happened after the click. A better-looking score gave everyone permission to postpone it.
AI visibility software gives that move a fresh coat of paint. Swap the Quality Score scale of 1 to 10 for a visibility index of 0 to 100. Instead of tweaking ad copy, the vendor runs prompts and formats the answers. Neither activity, on its own, fixes the commercial problem. A better score is not a substitute for a better result.
The vocabulary makes watching sound like work
The names are doing a lot of selling. As we described in The AEO Agency Glossary, a pitch deck can make monitoring sound remarkably like execution. Strip off the labels and ask what actually changes.
Take Share of Model. Vendors define it as the share of relevant LLM answers that mention your brand across a target prompt set. That fraction depends on the prompts you chose, as well as the answers the model happened to give. In one testing initiative, 12 brand-recommendation prompts run roughly 3,000 times produced the identical list of brands less than 1 time in 100. A movement in your chart deserves investigation. It does not automatically mean buyers are seeing more of you, much less buying from you.
Then comes the AI Visibility Index, weighting mentions by where the brand appears in generated text. Sentiment Trend classifies whether the answer says nice things about your software. There may be reasons to track either. But neither term contains an execution mechanism. Neither tells you that a page was fixed, a clearer comparison was published, or a buyer clicked through and signed a contract. They describe an answer a model produced. Staring at the index to improve pipeline is like checking your watch every thirty seconds to make the train arrive faster.
A report is easy to deliver because it changes nothing
This is why the subscription is so tidy. Pricing comparisons put some AI visibility tools between $29 and $489 per month, with enterprise tiers above $1,000. The vendor can query models, parse responses, and hand you tables without touching your CMS or production site. If visibility falls, the report has not failed. It has faithfully documented your problem.
That distinction matters. I do not object to measuring where a brand appears. I object to selling the measurement as if it closes the gap between absence and citation. Someone still has to do the work the chart identifies. If that someone is your already-busy team, the subscription has not removed the bottleneck. It has given the bottleneck a weekly email digest. Worse, that digest can look enough like a completed task that the underlying page stays untouched until next Monday’s edition.
Citations are won on pages, not dashboards
To improve your chances of appearing in an AI answer, you have to change what a retrieval system can find and use: accessible pages, clear answers, structured information, current comparisons, and useful first-party material. The Princeton GEO study discussed here focuses on changes to source content, not on how often someone refreshes a monitoring screen. The point is practical. An absent citation is a reason to inspect and improve the underlying asset, not to admire the chart of its absence.

That work might mean opening the CMS, refactoring a stale comparison table, fixing broken schema markup, publishing a first-party data asset, or making the answer on a page less painful to find. Each job has a different owner and a different route to publication. A dashboard without access to those assets cannot make the changes. It gives you the diagnosis and leaves you to arrange the surgery. If the diagnosis keeps arriving but nobody has time to operate, another alert is not the missing piece.
I would rather know who is responsible for that next step than see another colour-coded gauge. If the vendor cannot answer, the gauge is the product.
Eight questions to ask before you buy the gauge
Before you commit to a subscription, ask what happens between spotting an absence and changing a live asset. That is the distinction to keep in mind when evaluating tools meant to help you get featured in Google AI Overviews. A polished interface and a Monday report tell you little about whether anything will ship. Ask to see the route from finding to fix.
- Does it make live changes, or export suggested homework? An alert and a CSV are not execution.
- Can you inspect each change and its reasoning? If a tool edits content or code, you need to see what changed.
- What happens when the visibility score drops? A high-priority alert is still an alert.
- Who owns a bad outcome? Ask whether a named strategist or your own team must decide what to do next.
- Does it connect its work to qualified pipeline and revenue, or only to mention frequency? More mentions alone do not pay the bills.
- Does it update relevant content and technical markup, or only identify what is missing? Check the distinction in the live product.
- Does the price stay flat, or do prompt limits and metered tiers shape what you can monitor? Read the terms, not the demo slide.
- Will it ship real fixes in a live trial before you pay? This is the question most likely to disappear beneath the dashboard tour. Skip it, and you may spend months paying for reports while no live content or code changes.
The fix is execution you can inspect
Here is the test I actually care about. Suppose a competitor’s pricing page has a clear table, while yours buries the same sort of information in a wall of text. A dashboard spots the citation gap. Fine. What happens next? If your team must turn that observation into a ticket, find a developer or writer, debate the layout, and deploy the change weeks later, the vendor has sold you another place to discover work you already have to manage. The gap was visible before the report arrived. Now it has a colour and a recurring charge.
The alternative I want is execution within clear guardrails, with a human accountable for it. That is the case for groas over a monitoring-only subscription. Its specialized models identify gaps and make content and technical changes continuously, while a named human strategist sets direction and owns the commercial outcome. The point is not to remove judgment. It is to stop paying people to move an observation from one queue to another while the useful decision waits.
The record matters as much as the speed. “Consider expanding entity coverage” is not a plan; it is a horoscope with a login. If an engine updates a comparison table, changes structured markup, or refactors content, I want the action logged so a strategist can inspect what changed and assess what happened afterward. A chart of mentions cannot do that job. When performance slips, I need to know what the system did, not just receive an email announcing that Thursday was worse than Tuesday.
Some people really do only need the chart
If your job is to track brand perception, study model behaviour, or monitor how an interview appears in AI answers, buy a monitoring tool. In those roles, the report may be the deliverable. You are not being asked to turn the finding into qualified pipeline.
A commercial growth team has a different job. It cannot pay payroll with a higher Share of Model dial or show an AI Visibility Index to the board and call it revenue. If the report helps you choose and verify changes, keep it. If it merely lets you watch competitors appear where you do not, stop confusing a sharper picture with a fix.
You do not need better binoculars. You need someone to move the damn page.