

 LinkedIn

Position 3.0. 4,033 impressions. One click. I pulled 90 days of our Search Console data last month, and that was the row I could not explain away as a ranking problem. Its click-through rate was 0.02%. The page appeared on page one; almost nobody visited.
I used to tell clients that a position-3 ranking meant traffic was coming. I was wrong about how long that rule would hold for informational queries. Our server logs showed another kind of activity during the same window: ChatGPT-User fetched one of our informational posts 569 times. Those are not 569 proven citations, and the logs cannot tell me where the missing clicks went. But they make a question impossible to ignore. If a page gets seen in search and retrieved for live answers without earning visits, why grade its SEO work on sessions alone?
My answer is to measure enquiries and citations alongside traffic, not to pretend the clicks will return because we rewrote a title. Here is the split behind that decision, its limits, and a way to check whether the same pattern appears on your site.
The split: branded searches still click
I separated our Search Console queries the way I used to separate client accounts when traffic fell and everyone blamed the title tags: queries containing our name in one group, everything else in another. The branded group behaved as you would expect. People who typed our name wanted our site, and Google still sent them.
Our main “groas” query earned 620 clicks from 2,323 impressions, a 26.7% CTR. That is not a site-wide branded average; it is one query from our 90-day export. It gives the informational rows a useful point of comparison, not a universal target.
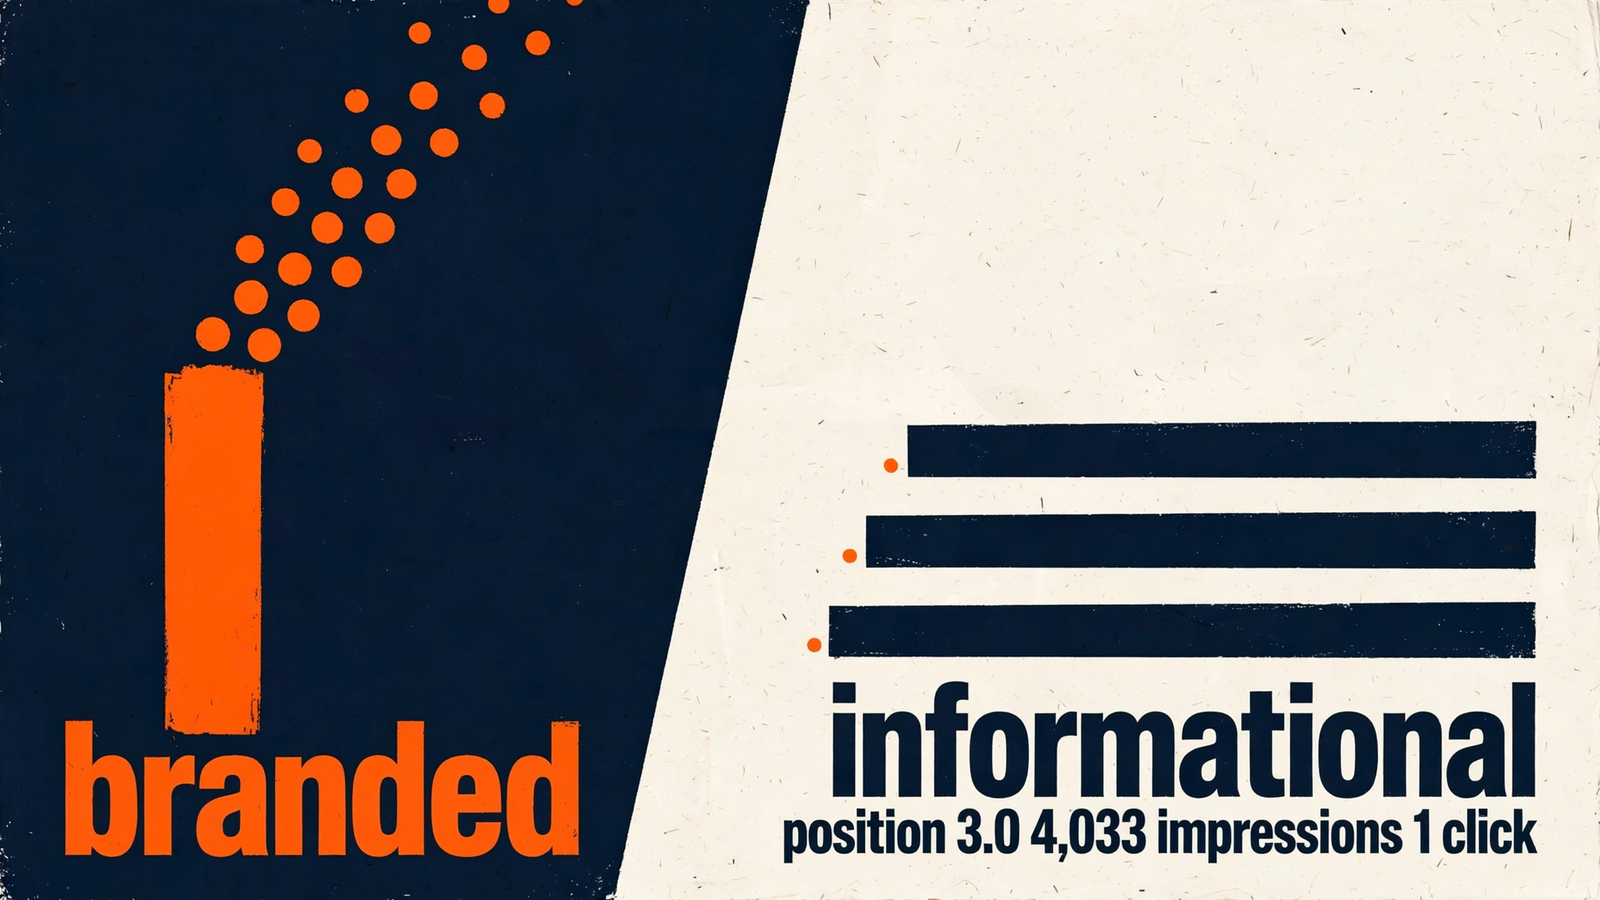
The informational rows looked nothing like it. These figures come from the same 90-day Search Console export; the labels stand in for the individual queries.
| Query type | Impressions | Clicks | CTR | Average position |
|---|---|---|---|---|
| Main branded query | 2,323 | 620 | 26.7% | Not shown here |
| Informational A | 1,355 | 18 | 1.33% | Page one |
| Informational B | 3,981 | 9 | 0.23% | Page one |
| Informational C | 4,033 | 1 | 0.02% | 3.0 |
The bottom row started this piece. It did not fail to rank. It ranked, appeared thousands of times, and produced one visit. A weak title might contribute to a low CTR, but position alone cannot tell us that the title is the cause. It also cannot tell us what else appeared around the result or whether the searcher needed to open a page at all.
That distinction matters because the usual fix for a disappointing row is to polish the snippet and wait. I have done that work. It is worth doing when the snippet misrepresents the page or the page misses the query’s intent. It is a poor explanation, though, for an entire group of page-one informational queries getting seen far more often than they get visited. The split is the finding; the position-3 row is its sharpest example.
How unusual is 0.02% at position 3?
Outside benchmarks help size the gap, but they are not a control group for our queries. The CTR benchmark cited in this comparison puts position 3 at 5.8% without an AI answer, 0.8% with one, and 1.7% blended. Our 1.33% informational row sits near that blended figure. The 0.23% and 0.02% rows sit well below it.
| Position-3 comparison | CTR | Source and limit |
|---|---|---|
| No AI answer | 5.8% | Outside benchmark; not our query mix |
| AI answer present | 0.8% | Same benchmark; not proof our result had an AI answer |
| Blended | 1.7% | Same benchmark; an average, not a forecast |
| Our Informational C | 0.02% | Our 90-day Search Console export; one query |
A larger study points in the same direction without explaining our individual row. Ahrefs re-ran 300,000 keywords, half triggering an AI Overview and half informational keywords without one. It reported position-1 CTR for AI Overview keywords falling from 0.073 in December 2023 to 0.016 in December 2025, about 58% below its forecast without AI Overviews. The reported drag was 58% at position 1, 46.4% at position 3, and 19.4% at position 10.
Those are study results, not multipliers to apply to our account. Our position-3 row performed worse than the reported average. It suggests that averages can hide queries on which a searcher gets enough from the results page to leave without clicking. It does not identify which feature, if any, satisfied the people behind those 4,033 impressions.
At the edge: 569 fetches, not 569 confirmed answers
Our server logs add a second view. One informational post in this low-click group was fetched 569 times by ChatGPT-User in the same window. ChatGPT-User is described as a live fetcher rather than an index crawler: it retrieves pages when they are needed for an interaction.
That is evidence that our page was retrieved. It is not evidence that ChatGPT cited it 569 times, sent us 569 prospects, or answered the exact query in the bottom row of the table. Search Console records what happened to our result in Google; the server log records requests for a page. I cannot join those records into a single user journey.
Still, putting them side by side changes the working question. “Why did this page get no traffic?” treats the click as the whole outcome. “Where is this page being seen, retrieved, cited, and followed by an enquiry?” asks what the page is doing before and after a visit. Keep the fetch count beside the click table, not inside it.
What these numbers can—and cannot—say about lost clicks
The possible mechanism is straightforward. A search result can show a page while an answer on the same screen gives the searcher what they came for. Separately, a live assistant can fetch a page to help produce an answer without sending the user to the source. Both routes can create exposure without a visit. Our low-click queries and live fetches are consistent with that shift.
They do not prove that every lost click moved into an AI answer. Three limits matter:
- SERP layout: A shopping carousel, video pack, or People Also Ask block can depress CTR while the reported average position stays on page one. Position does not show everything surrounding the link.
- Intent: A query that looks informational in an export can represent different needs across thousands of impressions. Some searchers may never have wanted to open a page.
- Sample: These are our queries and our server logs, not a market panel. The post receiving live fetches is part of the same informational group, but the logs do not connect each fetch to a Search Console impression.
Reddit reported falling search referrals in Q3 2026 and a drop of more than 1 million referrals per week on average in October. Its CEO pointed to AI Overviews and AI Mode pushing classic results down. That report gives the pattern broader context, not a missing link in our own data. Different site, different audience, different causes that cannot be separated by our export.
I am comfortable with a narrower conclusion: for these informational queries, ranking and traffic have come apart. Our logs show that at least one post was also being fetched for another answer surface. That is enough to change what I ask an SEO report to measure. It is not enough to announce that I have accounted for every click.
The measurement change: enquiries first, citations next
Sessions made our informational posts look as if they were doing almost nothing. The combined record is less tidy: few Google clicks, repeated live fetches, and no automatic way to tell from either number whether a buyer later contacted us. I do not replace one incomplete metric with another. I put the outcomes in order.
- Enquiries attributed to organic search and AI referrals. If the business needs pipeline, this is the first number to inspect. A fetch is not an enquiry, and a citation is not one either.
- Citation presence on buyer questions. Check whether the brand appears in the answers people receive, rather than assuming a retrieved page was named or linked.
- Branded search impressions. Treat growth here as a possible downstream signal of recognition, not proof that a particular answer caused it.
- Verified live fetches, where logs allow them. They show retrieval activity that a sessions report misses. They do not, by themselves, show what the assistant said.
For citation presence, Search Engine Land’s visibility protocol gives a plain calculation: answers mentioning your brand divided by total answers, multiplied by 100. Run the same 50 buyer questions through ChatGPT, Gemini, Perplexity, and Google AI Overviews each week. Record citation rate, share of voice, and sentiment alongside the enquiries. Keeping the questions consistent matters more than finding a prettier dashboard; otherwise, a change in the test can masquerade as a change in visibility.
Our branded query held a 26.7% CTR while the informational examples ranged from 1.33% to 0.02%. That contrast makes branded search worth watching. It does not mean every new branded impression came from an AI citation. If citations rise and branded impressions rise later, the relationship is useful to investigate. The enquiry record is where I look for commercial value.
The wider zero-click figures need the same restraint. One analysis reports news searches without clicks rising from 56% to about 69% between May 2024 and May 2025, while warning that the figure is news-specific, not a rate for all searches. Your query mix may look nothing like a news publisher’s or ours. That is why the next move is to make your own split.
Test protocol: run the 90-day split on your site
Question: On your domain, do page-one informational impressions still produce visits, or does their click pattern look more like ours?
Setup: In Search Console, open Performance, set the date range to the last 90 days, and export queries with impressions, clicks, CTR, and average position. Separate queries containing your brand name and close misspellings from the rest. For the non-branded group, the zero-click tracking method described here uses a Query custom regex that excludes the brand pattern.
Controls: Keep both groups in the same date window and compare position bands within each group: positions 1–3, 4–6, and 7–10. Calculate clicks divided by impressions for each band instead of blending the whole site together. Then inspect the high-impression, low-click queries individually. The non-branded bucket will contain more than informational searches, so do not label every row “informational” without reading the query.
What to measure: Record impressions, clicks, CTR, and average position for each group and band. Beside that table, record any verified live fetches of the relevant pages that your host exposes. Where available, Google’s Generative AI performance reports can add page-level impressions in AI features, though the reports described there do not provide clicks, CTR, position, or queries. That is an appearance measure, not a substitute for enquiries. My earlier look at our edge logs taught me to keep fetch evidence visible without pretending it belongs to a particular search query.
Expectation: I expect branded queries near the top of the results to retain a much stronger CTR than informational queries if answer surfaces are absorbing the easy part of the question. Ours showed 26.7% on the main branded query, while the informational examples ran from 1.33% down to 0.02%. Those are observations from our account, not thresholds yours must hit. The mechanism I am testing is whether the searcher can get the needed fact before opening the source page.
How I would read the result: If page-one informational impressions are steady or rising, CTR is under about 1%, and branded CTR in the same account remains above 15%, investigate the answered-elsewhere pattern before spending weeks rewriting titles. Look at the results page and at any available citation or fetch evidence. Make the page easy to cite with a plain definition near the start, a table or steps that can stand on their own, and a next step only your business can fulfill, such as a quote or booking.
If impressions and CTR are both low, or branded CTR is also falling, I would not diagnose answer displacement from this split. Check whether the title makes the right promise and whether the first screen delivers on the query. I burned enough weeks treating every weak row as a title problem; I would not make the opposite mistake and call every weak row an AI problem.
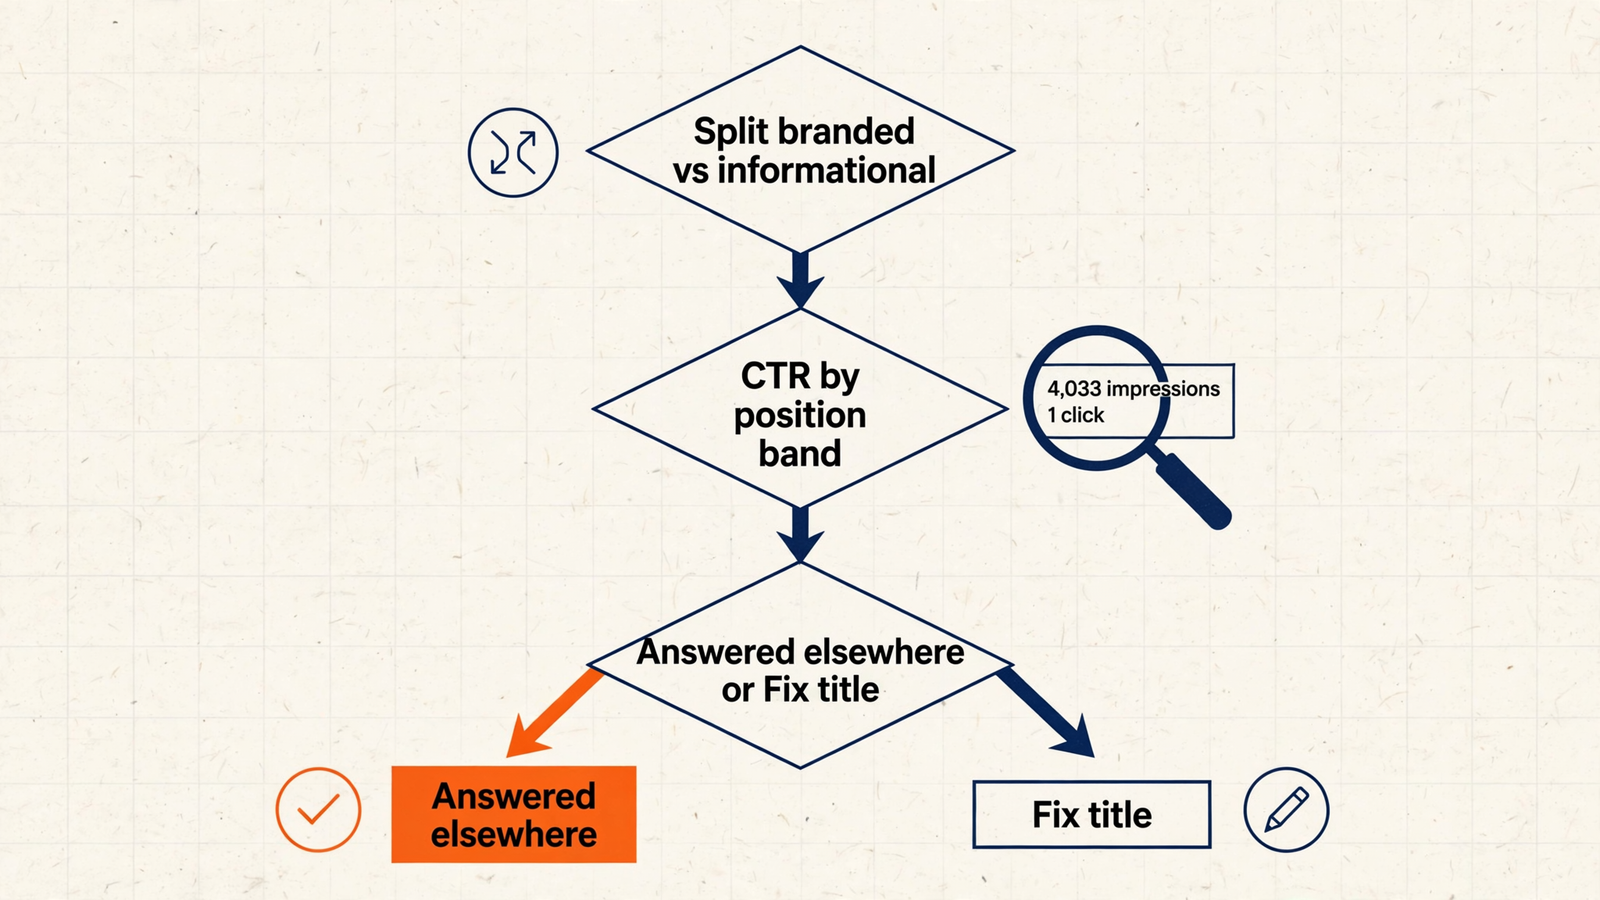
Either result changes the work. The first moves attention toward citations and attributed enquiries without abandoning the page. The second sends you back to the search result and the page itself. The split is a diagnostic, not a victory lap for either theory.
The decision: stop selling the click as the whole result
I would ask an SEO provider for the four numbers above before accepting sessions as the headline: attributed enquiries, citation presence on a consistent set of buyer questions, branded search impressions, and verified live fetches where available. We have also written about 1,777 live answers in 30 days in a related piece. That kind of edge evidence belongs in the discussion, but it still needs to be kept distinct from visits and revenue.
This is the distinction I care about at groas. Daily publishing and technical fixes matter when they support visibility that can be checked against pipeline. Our SEO and AI Search offering pairs that continuous work with tracking and a named person accountable for the result, on a flat monthly fee. I do not want to buy back a sessions chart if the business needs enquiries. Position 3 with 4,033 impressions and 1 click may represent distribution without a visit; the job is to find out whether any of that distribution earns a citation and, ultimately, demand.
One exception before you shift the work. If most revenue comes from high-intent local queries with three or four competitors in the map pack, classic clicks still pay the bills. Keep titles, reviews, and call buttons first. I would not trade bottom-funnel fixes for citation work when the phone has stopped ringing. Start with the split, find which group is actually weak, and put citation effort where informational impressions are high, rankings hold, and clicks have gone quiet.