

 LinkedIn
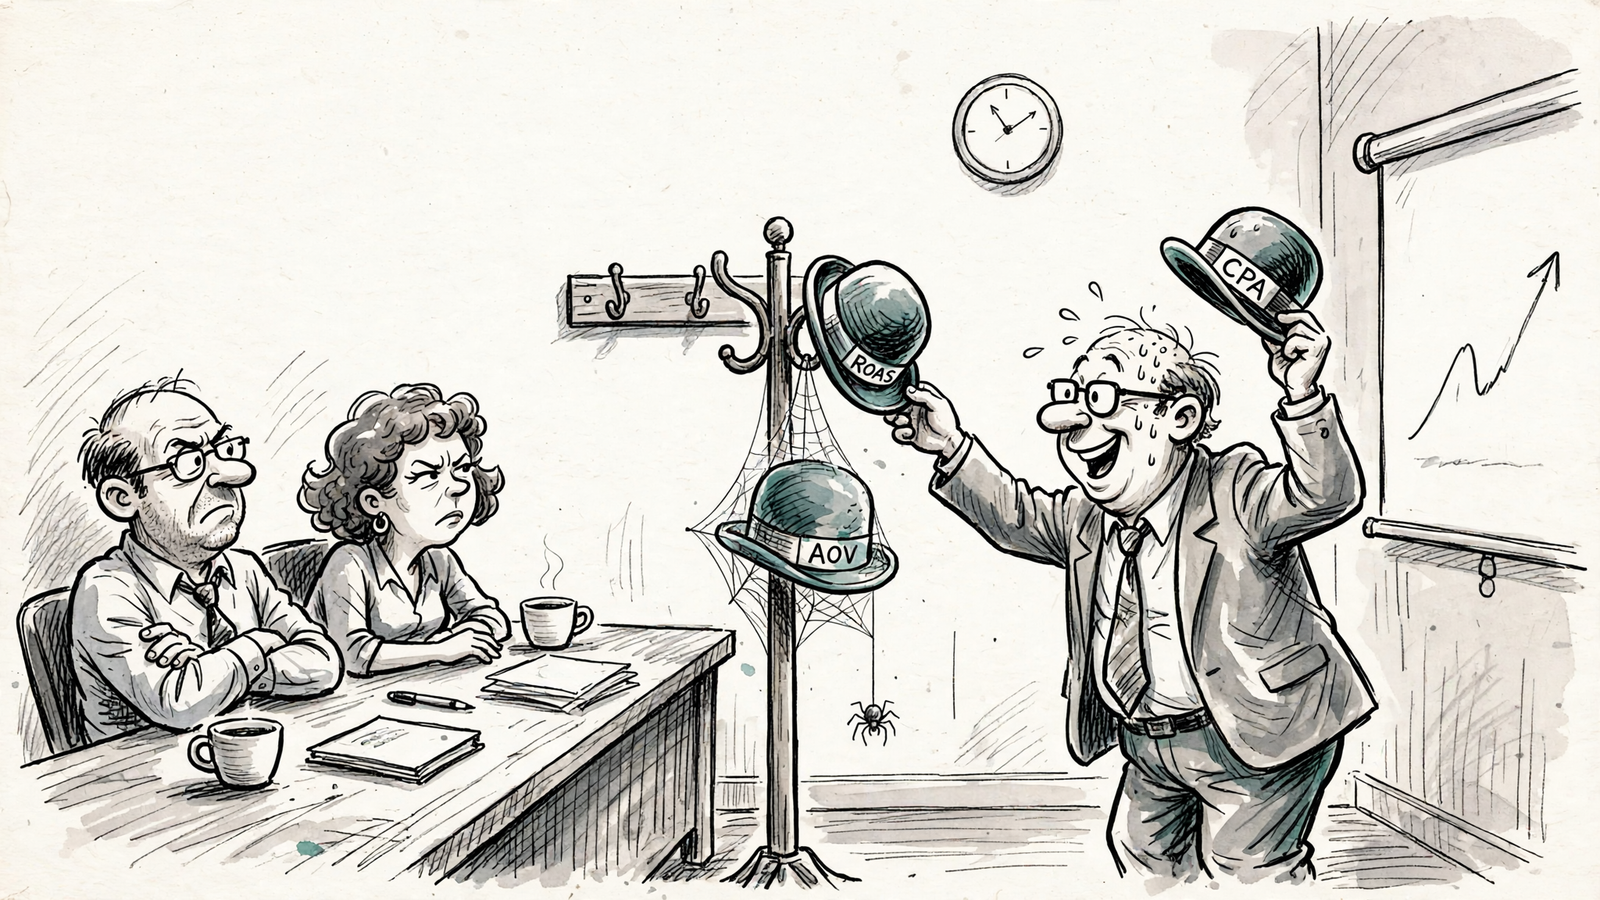
Most agencies won’t tell you this: there is no CPA vs ROAS debate until order value enters the room. I spent years reporting both numbers to clients as if they were separate verdicts. One month CPA looked great, so we celebrated. The next month ROAS looked better, so that went in the subject line. That was reporting, not management.
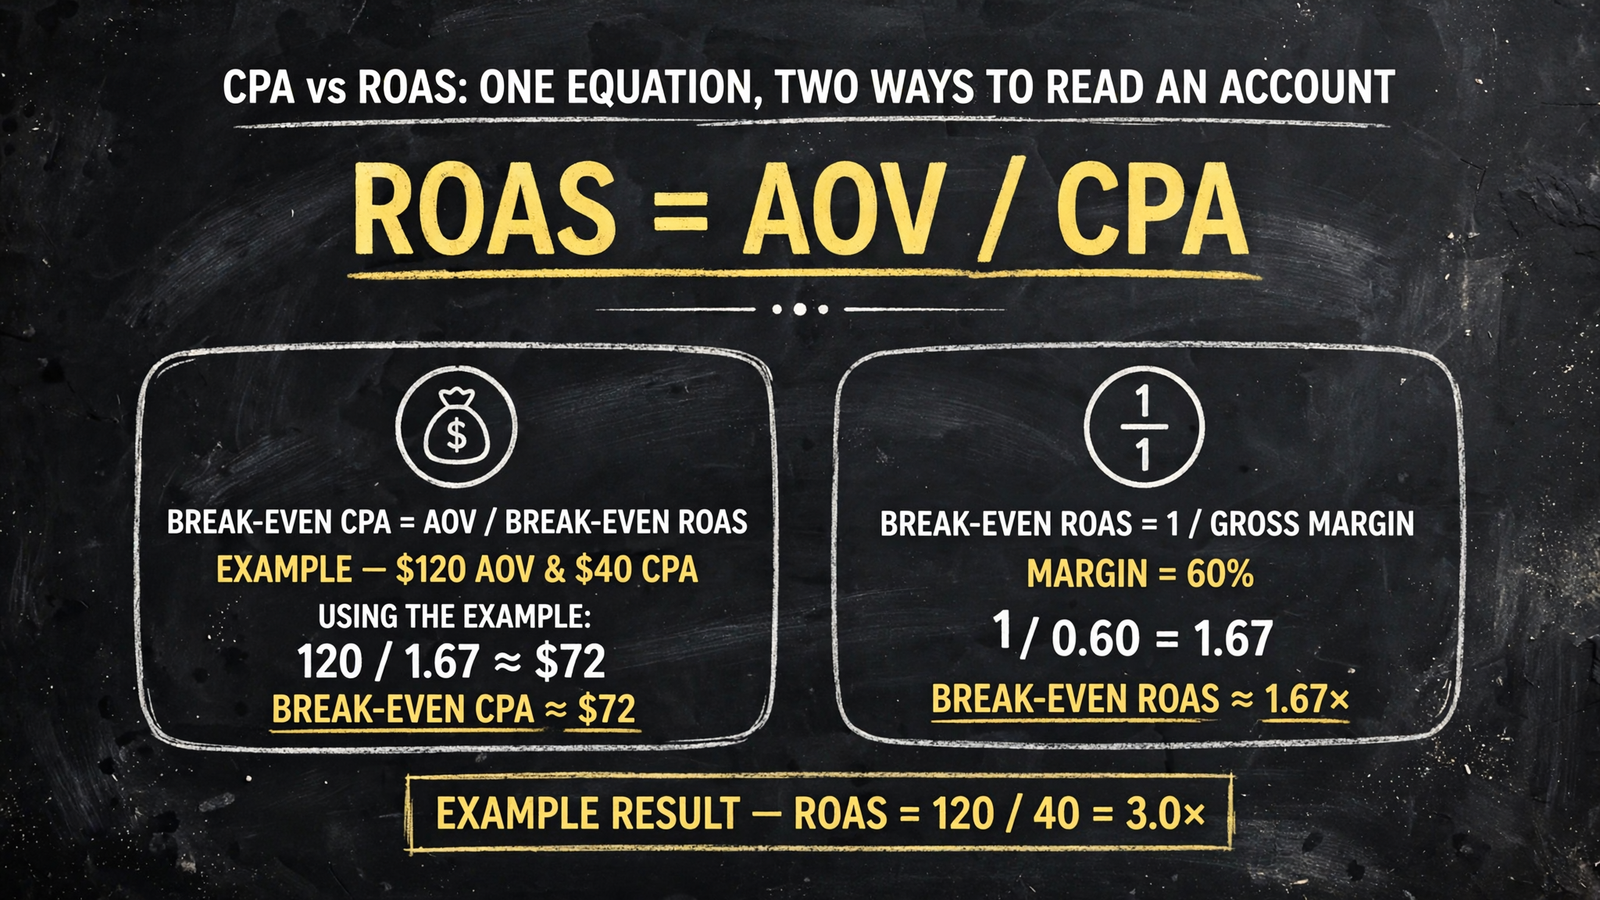
Here is the fact everything else follows from: ROAS = average order value ÷ CPA. If you know what an average order is worth, you can translate one metric into the other. The useful question is whether order value varies enough that CPA alone hides what is happening to revenue.
Start with spend, orders and order value
Start with what you count. Spend is the money you put into ads. Conversions are the actions you told the account to count. CPA is ad spend divided by conversions; ROAS is attributed revenue divided by ad spend. Spend $2,000 to produce 100 purchases and $10,000 in revenue, and you have a $20 CPA and a 5.0 ROAS. Same activity, two readings.
I will use one running example rather than ask you to memorize formulas. Say you spend $20,000 in a month and get 500 orders. Average order value, or AOV, is $120, so attributed revenue is $60,000. Divide spend by orders and CPA is $40. Divide revenue by spend and ROAS is 3.0.
The connection starts with revenue: orders multiplied by AOV. Substitute that into ROAS, and you get orders multiplied by AOV, divided by spend. Since spend divided by orders is CPA, ROAS equals AOV divided by CPA. In our example, $120 divided by $40 is 3.0.
Now change one thing at a time. Cut CPA from $40 to $30 while AOV stays at $120, and ROAS rises from 3.0 to 4.0. CPA and ROAS tell the same story. But if you reach that $30 CPA by attracting $60 orders instead, ROAS falls to 2.0. You bought orders more cheaply and got less revenue per dollar spent. A better-looking CPA did not mean a better account.
When AOV stays steady, CPA and ROAS move together. When AOV moves, check both before calling a cheaper conversion a win. The equation tells you why; it does not require a favorite metric.
Let margin set the break-even point
Revenue still is not profit. A 4.0 ROAS sounds good until you know the margin on those orders. A $40 CPA sounds good until you know what an order leaves after its variable costs. I used to tell clients that 4x ROAS was the goal. I was wrong. Another company’s target cannot tell you what your orders can afford.
You break even on an acquired order when its available profit covers the cost of acquiring it. That makes break-even CPA the profit per order before ad spend: AOV minus COGS and variable costs. Take a $100 order with $40 in COGS and $5 in variable fees. It leaves $55 for acquisition. Pay $56 for that order and you have spent more to get it than it contributes, even though the sale produced revenue.
The ROAS version follows from the same margin. If $40 of each $100 in revenue is available to pay for ads, you need $100 in revenue for every $40 spent. That is a 2.5 ROAS. In general, break-even ROAS is 1 divided by gross margin: a 40% margin needs 2.5, a 30% margin needs about 3.33, and an 80% margin needs 1.25. To leave profit after ad spend, your target needs to sit on the profitable side of break-even.
Return to the $120 order. Say it leaves $60 after product, shipping and fees: a 50% margin. Break-even CPA is $60, and break-even ROAS is 2.0. At a $40 CPA and 3.0 ROAS, that leaves $20 per order before overhead. Both metrics describe the same room between acquisition cost and the margin ceiling.
That ceiling is only as useful as the costs behind it. Returns, refunds and fees can change the margin you actually keep. If you set targets using profit you never collect, neither a tidy CPA nor a tidy ROAS will rescue the decision. Work out what an order contributes first. Then set the target.
Watch what changes when orders have different values
Now imagine two campaigns under that $20,000 monthly spend. This is a different order mix from the 500-order example, and that is the point.
- Campaign A spends $10,000 for 400 orders averaging $75. Its CPA is $25, and its ROAS is 3.0.
- Campaign B spends $10,000 for 222 orders averaging $180. Its CPA is about $45, and its ROAS is about 4.0.
If you rank those campaigns only by CPA, A wins. If you rank them by revenue per dollar spent, B wins. That does not mean you shut A off on sight; margin still determines what each campaign earns. It means a CPA-only ranking misses the difference in order value. You cannot settle this comparison by arguing that $25 is inherently better than $45.
The bidding mechanism follows the same logic. Target CPA treats counted conversions equally, while Target ROAS bids toward conversion value. If a $50 accessory order and a $500 bundle both count as one purchase, a system pursuing cheaper purchases has no reason to prefer the bundle. I have watched accounts cut CPA while revenue fell. The algorithm was doing what it was told: finding cheaper conversions, not more valuable ones. If your basket varies substantially, CPA is a poor steering wheel on its own. I go deeper on that choice in Target CPA vs. Target ROAS: One Bid Decision, Two Ways to Get It Wrong.
Lead generation has the same problem one step later. Two keywords might each produce a $60 lead. If one closes at 5% and the other at 25%, equal lead CPA conceals a fivefold difference in customers. Before deciding what a lead is worth, connect it to the sale: break-even lead CPA equals profit per customer multiplied by the lead-to-sale rate. At $1,000 profit per customer and a 20% close rate, that is $200 per lead. If you are willing to devote only half that profit to acquisition, the target becomes $100.
Notice what you must decide before using the formula: which profit counts. First-job profit and profit over a 12-month window are different inputs. Pick the window you can support before you pick a bid target. Otherwise, a cheap lead can look efficient right up to the point where it fails to become a customer.
Repeat purchase changes the window for an order, too. In the running example, one $120 order leaves $60 before acquisition. If that same customer places two more orders in a year at the same margin, those three orders leave $180 in total before acquisition. The first-order break-even CPA was $60; the one-year ceiling for that customer is $180. That is not permission to bid $180 for every new customer. If the repeat purchases do not arrive, or you cannot fund the wait, the larger ceiling exists only in your spreadsheet. For a case built around this distinction between revenue and margin, see How an Ecommerce Brand Fixed ROAS by Rebuilding Around Margin.
Do not let a blended number pick the winner
I have sat in the meeting where CPA crept from $40 to $52, so the slide led with blended ROAS holding at 3.4. The next month ROAS dipped, so the headline became conversions up 12%. What the deck calls a rounded view, I call picking the hat that fits.
Blending makes that easy. One brand campaign at 8.0 ROAS can hide three prospecting campaigns at 1.6. CPA can conceal the opposite problem when cheap, low-value orders pile up. Neither account-wide number tells you which campaign changed the result, because the orders underneath it are not interchangeable.
One set of Search benchmarks puts average CPC at $4.34, up 19% year over year, Search ROAS around 4.21x and average cost per conversion near $76. You still cannot borrow those averages as your targets; your margins and order mix set those. But paying for a campaign that quietly pulls AOV from $120 to $85 while CPA holds steady is an expensive way to learn why the third column matters.
Put CPA, ROAS and AOV side by side for each campaign. Then ask which input changed. A cheaper CPA with stable AOV has one explanation. A cheaper CPA accompanied by a steep drop in AOV has another. If a report shows only whichever metric improved, it is a highlight reel, not a basis for moving budget.
Try the model on a home services account
Take a home services account with $15,000 in spend and 150 calls. That is a $100 CPA per call. Say 30% of those calls become booked jobs: 45 jobs at $800 each, or $36,000 in revenue. Revenue divided by ad spend gives you a 2.4 ROAS.
The equation still works, but you must use the same kind of conversion on both sides. At the call level, attributed revenue per call is $36,000 divided by 150, or $240. Divide that $240 value by the $100 call CPA and you get 2.4 ROAS. You could instead count booked jobs, but then you would need to use cost per booked job as your CPA. Switching from calls to jobs halfway through the calculation is how an apparently simple target becomes nonsense.
Now bring margin back in. At a 55% gross margin, each $800 job leaves $440 before acquisition. With 30% of calls closing, each call is worth $132 in expected profit before ad spend: $440 multiplied by 30%. Break-even CPA per call is $132. Paying $100 leaves $32 per call against that ceiling, on these assumptions.
Change only the close rate to 20%. A call now carries $88 in expected profit before ad spend: $440 multiplied by 20%. The $100 CPA has not moved, but it is above the new break-even point. The same cost that looked safe now loses money. The ads did not have to change. The close rate did.
That gives you a way to choose without a blanket rule. For conversions worth roughly the same amount, CPA carries most of the information you need, provided you set it against a margin-based ceiling. If order values or close rates spread widely, an account-wide CPA hides the variance. Track value where it changes, whether that is at the order, lead source or booked-job level, and read ROAS alongside the costs required to produce it.
This is also where monthly account reviews fall short. CPA, AOV and the mix of conversions can change between reviews. A human opening the dashboard on Friday may spot a fall in order value after the budget has already followed cheaper orders. The work is not to admire three metrics more often. It is to watch how they connect, adjust bids and budgets when the mix changes, and keep a record of those decisions. That is the job groas takes on as a done-for-you service: always-on bidding and budget work within guardrails you set, with changes logged rather than buried beneath the best-looking headline. The distinction between following a platform’s target and following your revenue is worth examining in Does Google Smart Bidding Optimize for Google’s Revenue, Not Yours?.
Takeaway: find the value that varies
Go back to the home services account. With a steady $800 job value and a steady close rate, a margin-based CPA ceiling for calls gives you a usable target. When close rate falls from 30% to 20%, that ceiling falls from $132 to $88 even though reported call CPA stays at $100. You do not need a new favorite metric. You need to notice which value changed.
The same reasoning applies to orders. When AOV barely moves, CPA and ROAS are the same answer in different clothes. When AOV swings, ROAS reveals what CPA can hide. ROAS = AOV ÷ CPA is not a slogan for choosing sides. It is the check that tells you whether the side you chose still describes the business.