

 LinkedIn

YouTube sold $11.2 billion in ads in Q3 2026, up 9% year over year. That is a record-sized business growing more slowly while YouTube creates more ways to show an ad. For advertisers, the viewer complaint is not just a complaint. It is a signal to check whether cheaper-looking reach is buying less attention.
I used to tell clients that fast revenue growth meant rising prices. I was wrong to treat revenue as a price report. Revenue combines price and quantity, and YouTube does not publish the impression count needed to separate them. Still, when ad opportunities expand and revenue growth slows, I want to know what happens to frequency, placement mix, and cost per sale. Those are the numbers an advertiser can act on.
The revenue number is large. Its price signal is limited.
YouTube ad revenue measures dollars across formats, including skippable and non-skippable ads, bumpers, Shorts, and newer placements. It does not tell us the CPM for each format or how many impressions produced the total. That is the first limit on any claim that YouTube ads got cheaper.
| Quarter | Reported YouTube ad revenue | Year-over-year growth | What I take from it |
|---|---|---|---|
| Q3 2025 | $10.26 billion | 15% | A comparison point for the following year |
| Q1 2026 | $9.88 billion | 11% | Slower year-over-year growth |
| Q2 2026 | About $11.06 billion to $11.1 billion | 13% | Growth picked up before Q3 |
| Q3 2026 | $11.2 billion | 9% | More revenue, but slower growth |
The quarter-to-quarter dollar changes are not a clean demand trend; seasonality gets in the way. The year-over-year rates are more useful. By Q3, YouTube was growing at 9% while Alphabet grew about 25% to $127.6 billion. That gap does not prove YouTube’s CPM fell. It does make a rising-volume, softer-average-price explanation worth testing rather than assuming every new impression has the same value as the last.
Mix complicates the picture further. Shorts accounts for about 22% of YouTube ad revenue, versus 15% in 2024. The cited format estimates put Shorts at $4 to $8 CPM, versus $8 to $15 for standard in-stream, with conversion rates roughly 30% lower. Those are format-level comparisons, not a platform-wide clearing price. But if a larger share of a buy moves into lower-CPM inventory, an account’s blended CPM can fall without its targeting getting any better.
Practical takeaway: treat a lower blended CPM as a question about mix, not an answer about efficiency.
Three format changes make the supply question harder to ignore
The clearest change to ad opportunities is mid-roll placement. YouTube began prioritizing natural breaks, such as pauses and transitions, over cuts in the middle of a sentence. It also set out to add automatic slots at natural breaks on older videos with manual placements unless creators opted out, while allowing creators to combine manual and automatic slots. An early test averaged 5% more ad revenue than manual-only placement.
A better-timed break can be less irritating than an abrupt one. It can also create another opportunity to serve an ad. The test reports creator revenue, not a count of impressions across YouTube, so it cannot tell us exactly how much supply the change added.
The other changes affect what advertisers can buy or how long a viewer stays with an ad:
- Pause ads became available to all advertisers after a strong response, appearing when a video is paused. YouTube describes them as non-interruptive. It remains unclear from the reported rollout whether they replace regular breaks or add to the total.
- Longer TV non-skips changed the living-room experience. Thirty-second unskippable ads rolled out globally on connected TVs, replacing some skippable 30-second ads. A replacement is not, by itself, an extra slot. It can still change the attention and irritation attached to that slot.
I would not put those three changes into a spreadsheet as three identical supply increases. Mid-rolls can create more opportunities. Pause ads may add opportunities, but the net effect is not established here. TV non-skips change the format of some existing opportunities. The common advertiser problem is that a cheap impression now covers more kinds of viewing experience.
Complaints show friction, not a platform-wide ad count
A widely shared first-person account of an hour on free YouTube described stacked unskippable pre-rolls and mid-rolls, along with other frustrations. I believe the hour was annoying. I do not believe one viewing session measures the platform. The bad sessions get written up; the uneventful ones rarely do.
Complaints also track friction more readily than frequency. One long non-skip on a TV can feel worse than several short, skippable ads, even if the latter produce more impressions. That distinction matters when an advertiser tries to turn a viewer’s too many ads into a forecast for CPM.
Here is the chain I would test, rather than claim to have proved:
- More available ad opportunities or a shift toward lower-CPM formats changes the inventory an account buys.
- Its blended CPM falls or its impressions per dollar rise.
- Frequency climbs, or conversions fail to keep pace with impressions.
- Cost per qualified opportunity or closed-won customer gets worse despite the cheaper-looking media.
The public revenue figures and format changes motivate that test. They do not establish steps two through four for your account. Demand could rise alongside supply; formats could clear at different prices; your audience might respond differently from the average. This is why I take the complaints seriously without using them as a measurement instrument.
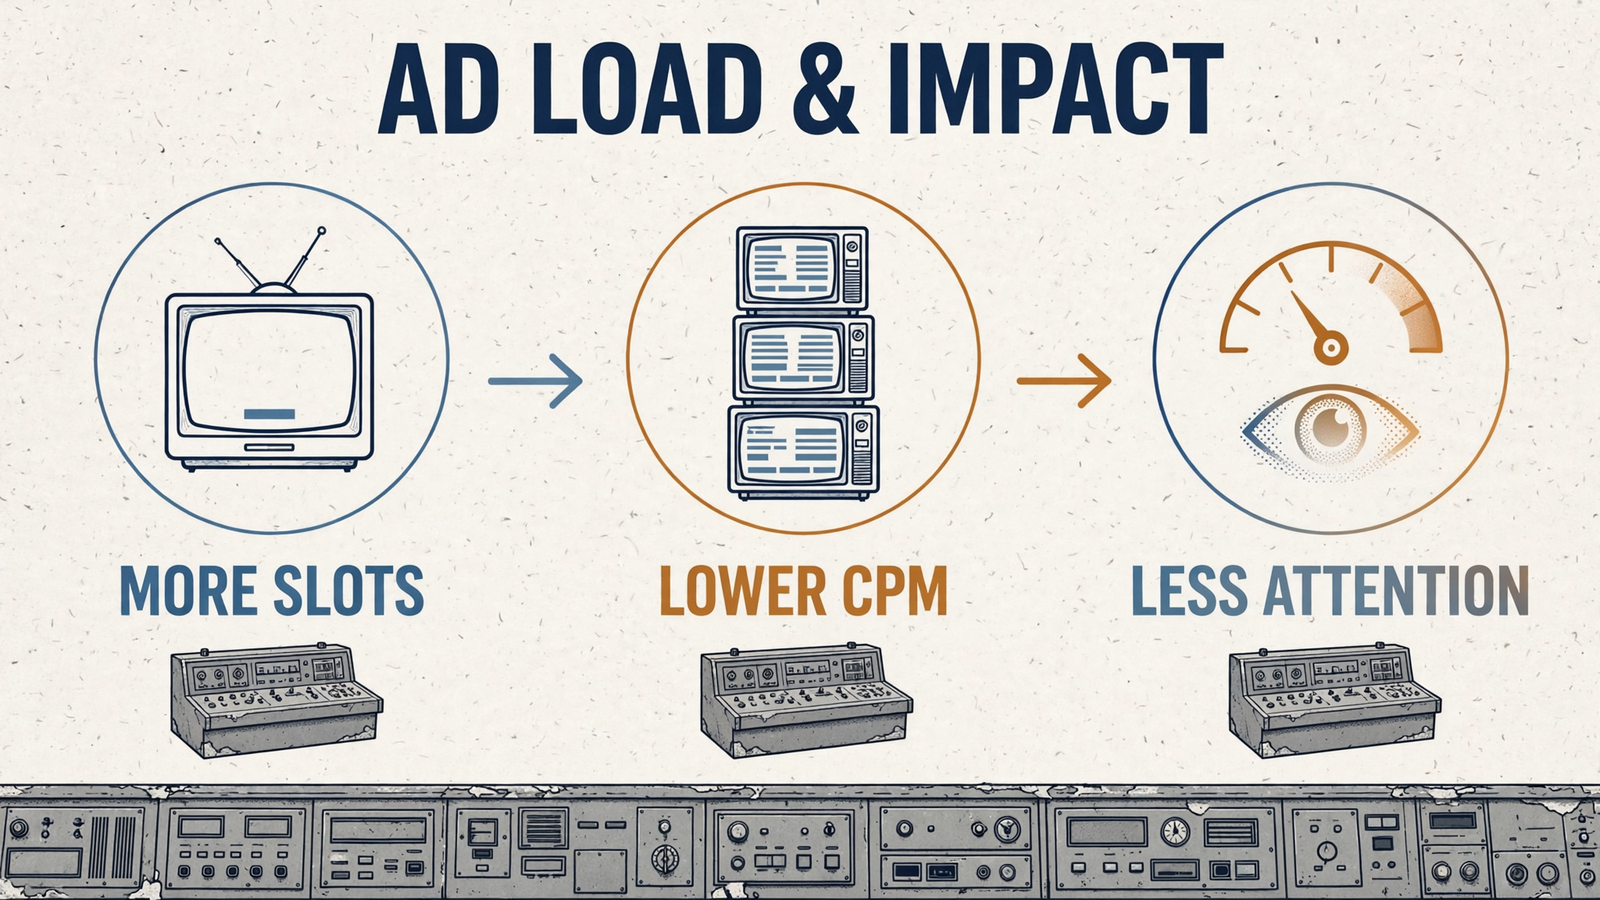
The possible second tax is attention. If the same viewer sees another break and then a pause ad while reaching for coffee, the next exposure may do less work than the first. That is a plausible mechanism, not a conversion rate supplied by YouTube’s revenue report. If you buy only high-intent Search, this is not your auction. If you buy YouTube reach, Demand Gen, or Video Action, you can test it in your own results. Cheaper impressions are only cheaper if the conversion economics hold.
Public figures stop before the metric that decides the budget
Revenue tells us dollars changed hands. It does not tell us what a viewer did. A completed TV view, a bumper, an ad on a paused screen, and a Shorts impression are different experiences. The reported total does not split out their attention or the sales each produced. That is where an advertiser’s CPA lives or dies.
I have seen accounts where the best-looking CPM came from inventory that delivered plenty of impressions and weaker conversion rates. The lower Shorts CPM and conversion-rate estimates show why I check the mix before congratulating myself. They do not establish what pause ads did in my account or yours. Nor would I let a view-through conversion report settle the matter: credit for a touch before a sale is not the same thing as proof that the touch caused it.
For that, I want a holdout or an exposed-versus-unexposed search-lift comparison, then qualified pipeline and closed-won outcomes where the sales cycle allows them. Those measures have their own limits, but at least they address the decision. The public data says to investigate dilution. Your account data decides whether you are paying for it.
Put a ceiling on repeats, then separate the cheap inventory
If you buy YouTube as one blended pool, lower-CPM formats can make the average look attractive while hiding where the budget went. I start with three controls, in this order:
- Cap prospecting frequency. I use three exposures per user per week as a starting point for prospecting and five for remarketing, where the campaign offers frequency controls. The point is not that three is a universal threshold. It is to stop repeat exposures from quietly consuming the budget, then check whether reach and CPA improve or deteriorate. In accounts I ran, uncapped Video Action could reach the same user 12 to 15 times in seven days once Shorts entered the mix. That was a reason to test a cap, not a reason to declare every fourth impression worthless.
- Separate formats you want to judge separately. I have written about how YouTube’s ad bloat can make advertisers pay to be ignored. Keep Shorts in a distinct test line with its own budget and CPA target rather than letting its lower CPM flatter an in-stream average. Review placement exclusions available to the campaign and remove embedded, parked, or consistently low-attention inventory where those controls apply. Do not assume a placement exclusion gives you a dedicated pause-ad switch.
- Make the target a business outcome. Set the in-stream test against a CPA tied to pipeline. Give the Shorts test its own target, then compare qualified opportunities and closed-won results over full sales cycles. I laid out a similar split in my piece on whether YouTube added more ad load. If Shorts cannot meet the bar you set, move its budget. A low CPM is not a reason to keep it running.
The order matters. First keep repeat exposures from running away. Then make the mix visible. Only then decide which line deserves more money. Otherwise Smart Bidding can appear to find a bargain while your report rolls very different impressions into one tidy average.
I change the scoreboard accordingly:
| Role | What I watch | Why |
|---|---|---|
| Primary | Cost per qualified opportunity and cost per closed-won customer, using CRM outcomes | This is the result the buy must earn |
| Secondary | Search lift in exposed geographies and branded search after a flight | These can help test whether the campaign changed behavior |
| Diagnostic | CPM, completion rate, view-through rate, and frequency | These explain delivery; they do not replace the outcome |
I have seen a report celebrate a 27% lower CPM in three weeks while CPA rose 14% in the same window. That is not an efficiency win. It is a prompt to inspect what changed in inventory, repetition, and conversion quality. My rundown of what changed for YouTube buyers comes back to the same rule: count the revenue event, not just the impression.
The $11.2 billion Q3 total and 9% growth rate do not prove YouTube sold every advertiser more impressions at a lower clearing price. The format changes and slower growth give me enough reason to check whether that is happening in a buy. I would watch frequency, isolate the lower-CPM formats, and let closed-won results decide the budget. That is the decision the numbers support.
I also watch for drift between reviews. Frequency can creep up; a cheaper format can take more of the budget than intended. That daily work is why I run YouTube through groas now: to keep caps, available exclusions, and CRM-backed targets under review instead of waiting until I remember to log in. Cheaper supply is only a deal if someone checks what it buys.