

 LinkedIn

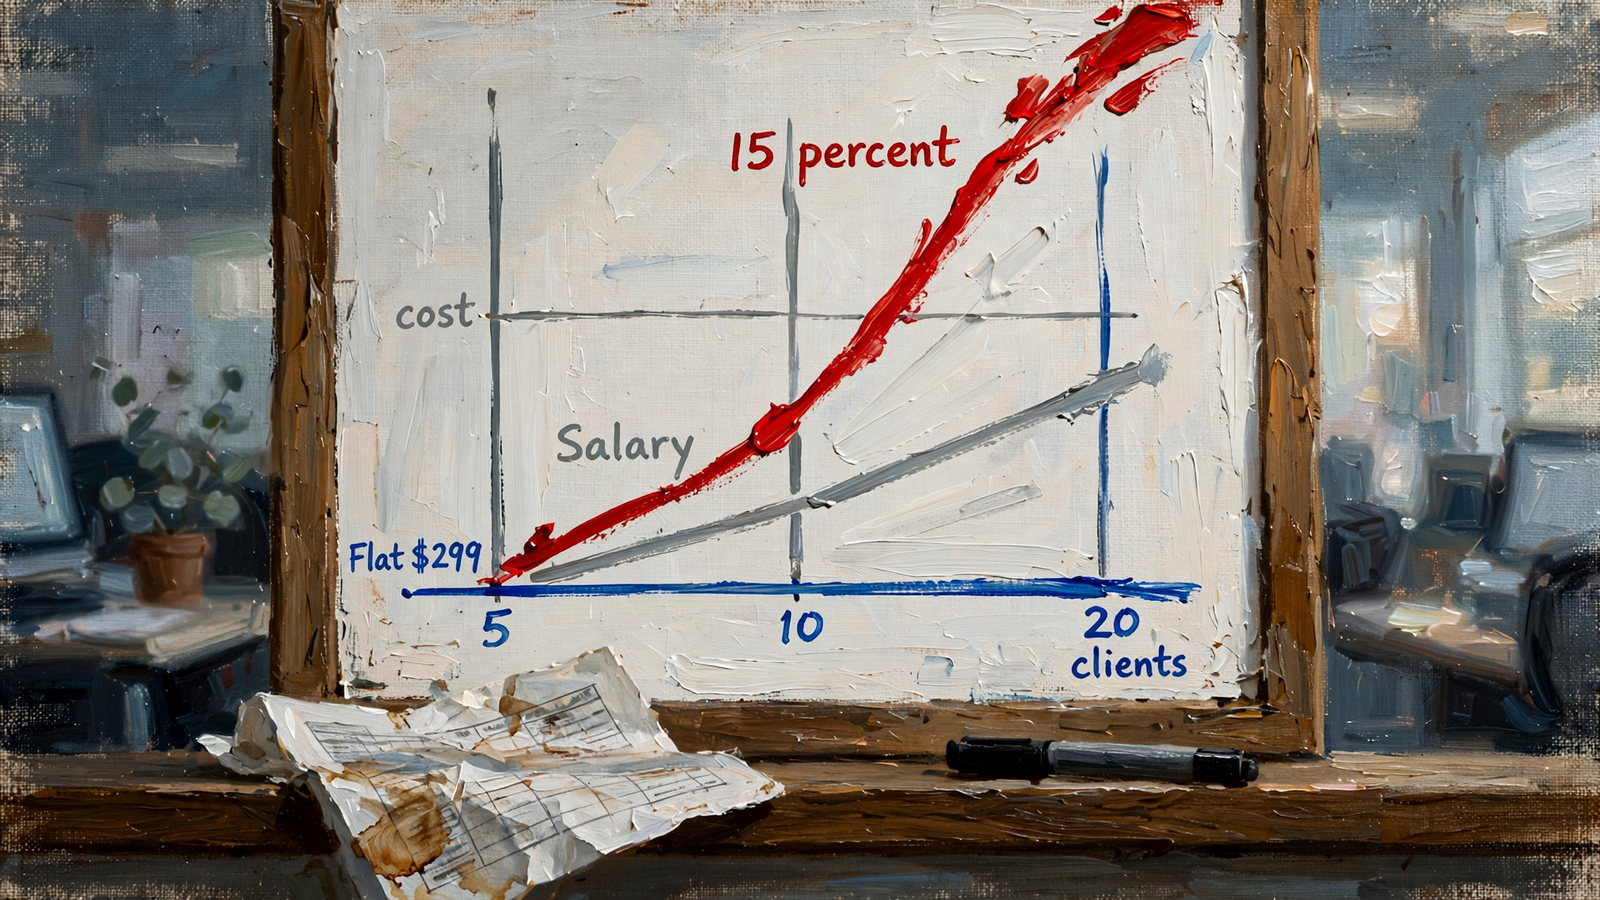
At 10 clients spending $10,000 a month each, a 15% fulfilment partner bills you $15,000 a month for delivery. The same 10 accounts at a flat $299 each cost $2,990. That is a $12,010 monthly gap, and it has nothing to do with how many campaigns you built.
Most agencies reach this decision by comparing a specialist’s salary with a fulfilment invoice. I have done that comparison. It misses the variable that decides the bill: what happens to delivery cost when client count and client spend rise. A salary buys blocks of capacity. A percentage follows spend upward. A per-account fee follows account count. Put those three behaviours in a sheet before you sign anything.
This is a model, not a quote or a performance test. I use the same inputs across 5, 10 and 20 clients, then show where the model stops being useful. Under its assumptions, percent-of-spend cannot beat flat delivery at any spend level because its per-account minimum is already higher than the flat fee. Hiring does not beat flat on delivery cost anywhere in the model. Those are narrower, and more useful, conclusions than “it depends.”
The capacity problem behind the invoice
I know when this question arrives because I have lived it. Your PPC person is full, two good clients are waiting on a proposal, and every option feels like a commitment: hire another specialist, hand the overflow to a fulfilment shop, or move delivery to flat white-label.
Capacity is not one universal account count. One agency scaling estimate says another hire is needed for every 6 to 8 new clients and describes a manual ceiling of 8 to 12 PPC accounts per manager. A practitioner roundtable puts the average at 4 to 7, with fewer when accounts need substantial strategy and testing. I use 10 accounts per specialist to keep the salary model legible, not because every specialist can responsibly carry 10.
That distinction matters. If your accounts need more hands-on work than the model allows, hiring gets more expensive sooner. If they need less, you may fill each salary block more efficiently. Neither change makes a percentage fee stop rising with spend.

Three prices, one set of assumptions
Here are the inputs. Replace them with your own before making a buying decision.
| Delivery option | Monthly cost used in the model | What makes the bill move |
|---|---|---|
| In-house specialist | $9,208 per head; up to 10 accounts per head | Another capacity block when the first 10 seats fill |
| Percent-of-spend fulfilment | 15% of each client’s spend, with a $500 minimum per account | Client spend, subject to the minimum |
| Flat white-label | $299 per account, with a five-account minimum | Number of accounts |
The salary input is an $85,000 annual base, within an agency hiring estimate of $70,000 to $95,000 and just below a reported $87,500 median for specialists with 3 to 5 years of experience. I multiply the base by 1.3 for benefits, taxes and tools. The BLS reports benefits at 29.8% of private-industry compensation; that is context for the loading assumption, not a precise benefits quote for this hire. The arithmetic comes to about $9,208 a month, whether the specialist has 5 accounts or 10.
For fulfilment, 15% sits in a reported 10% to 20% pricing band. The $500 minimum is a model input, not a claim that every shop in that band charges it. For flat delivery, I use the listed $299 per account with a five-account minimum. These figures make a clean comparison; they do not tell you what every provider will quote or what its service will include.
I exclude setup fees, your markup to clients, churn, recruiting, ramp time and the time your team spends overseeing any option. Some of those exclusions favour the hire; others may affect the delivery comparison. Keep them out of the table for now so you can see the cost structure. Put them back in your own sheet.
Five clients: the salary buys empty seats
Each row assumes every client spends the same amount per month. These are modelled monthly delivery costs, calculated from the linked inputs above, not observed agency bills.
| 5 clients at average monthly spend | In-house: 1 head | Percent-of-spend | Flat: $299/account |
|---|---|---|---|
| $3,000 | $9,208 | $2,500 | $1,495 |
| $10,000 | $9,208 | $7,500 | $1,495 |
| $30,000 | $9,208 | $22,500 | $1,495 |
At five clients, the hire costs the same as at ten because you buy the whole salary block. On this model’s capacity assumption, five of its ten account seats are empty. That does not mean the specialist has nothing useful to do; it means the delivery comparison does not give those unused seats a price you can recover.
Percent-of-spend looks attractive next to salary at $3,000 and $10,000 in average spend. That is the comparison that gets a busy owner to sign. But it is the wrong two-column comparison. At $3,000 per client, the $500 minimum produces a $2,500 bill, already above the $1,495 flat total. At $30,000 per client, the percentage bill reaches $22,500 while the flat total does not move.
Decision at five: do not hire solely to cover these five accounts if delivery cost is the deciding factor. The table does not price the value of an in-house specialist’s other work, so price that separately rather than hiding it inside account fulfilment.
Ten clients: a full hire still faces the flat fee
The hire now fills all ten modelled seats. That is its strongest position in the first two tables: no empty capacity to carry, and no second salary yet.
| 10 clients at average monthly spend | In-house: 1 head | Percent-of-spend | Flat: $299/account |
|---|---|---|---|
| $3,000 | $9,208 | $5,000 | $2,990 |
| $10,000 | $9,208 | $15,000 | $2,990 |
| $30,000 | $9,208 | $45,000 | $2,990 |
At $3,000 average spend, the percentage partner charges its $500-per-account minimum, so its $5,000 total beats the salary. At $10,000 average spend, it charges $1,500 per account: $15,000 in total. The specialist still costs about $9,208, but flat delivery costs $2,990. The gap between percentage and flat is the $12,010 a month from the opening, now with the assumptions in view.
The salary-versus-percentage crossover at ten clients is about $6,139 in average monthly spend: ten times 15% of that spend comes to roughly $9,208. Below that point, the percentage bill is lower than salary, provided the minimum does not change the calculation. Above it, salary is lower. Flat remains lower than either throughout the spend levels in this table.
Decision at ten: a full specialist can beat the percentage invoice, but that does not make hiring the cheapest delivery option. If you want that specialist for strategy, ownership or work beyond fulfilment, give those benefits their own line in the sheet.
Twenty clients: the second salary changes the shape
At account 11, the model needs another head. At 20, both specialists are full, so the table gives hiring its fairest two-person comparison.
| 20 clients at average monthly spend | In-house: 2 heads | Percent-of-spend | Flat: $299/account |
|---|---|---|---|
| $3,000 | $18,416 | $10,000 | $5,980 |
| $10,000 | $18,416 | $30,000 | $5,980 |
| $30,000 | $18,416 | $90,000 | $5,980 |
There is no mysterious efficiency gain at 20. Two loaded salaries cost twice one loaded salary. Twenty flat accounts cost twice ten flat accounts. The percentage bill also doubles when client count doubles, but it has another lever: spend. At $30,000 per client, 15% produces $4,500 per account, or $90,000 across the row.
A real agency would have management time, coverage questions and possibly a different account limit for each specialist. Those costs are absent here. They are not a reason to pretend the $18,416 salary total is more complete than it is.
Decision at twenty: do not compare two salaries only with the percentage invoice. Compare both with the per-account bill, then add the oversight each arrangement requires.
The fee that rises when a client grows
Hold account count steady and change only one client’s spend. At $3,000 a month, 15% is $450, so the model’s minimum makes the fulfilment charge $500. At $10,000 in spend, the charge is $1,500. At $30,000, it is $4,500. The flat input stays at $299 for that account in each case.
I call the percentage pattern a success tax. If a client increases spend, your delivery bill rises even when the account count stays put. The model does not prove that the work stays identical at every spend level; larger accounts can demand more work. It does show that the percentage price rises automatically, without measuring that work. That is the incentive problem behind percentage-of-spend pricing.
There is one break-even calculation worth separating from the actual model. Without a minimum, a 15% fee equals $299 at roughly $1,993 in monthly spend. Below that, the percentage would be cheaper; above it, flat would be cheaper. With the model’s $500 minimum, that crossover disappears: the percentage option starts $201 above flat for every account. Change the rate to 10% and remove the minimum, and the crossover moves to $2,990 in spend. That is a different contract, not a winning row in these tables.
I would not extrapolate from these costs to claim every flat provider delivers identical work, or that every growing account is equally easy to manage. The sheet prices the fee mechanism. It does not grade the work. Check the service and the wrapper separately; do not pay a rising invoice just because the first invoice looked small.
Put your own clients in the sheet
Averages make the three tables readable. They can also conceal the client mix that determines your actual percentage bill. To test a decision this quarter, build one row per client and keep the assumptions visible:
- Enter each client’s monthly spend. Calculate the percentage charge for that client, applying the agreed minimum, rather than multiplying a single average by your whole roster.
- Enter your loaded monthly cost per specialist and a realistic account limit. If your team can carry fewer than ten without dropping strategy and testing, model the extra salary block when it arrives.
- Enter the flat per-account price and any minimum commitment. The $299 input here comes with a five-account minimum; it is not a one-account price in this model.
- Add costs the tables omit. Include recruiting and ramp for a hire, and the time your team spends on QA, reporting and client communication for outsourced delivery.
An agency hiring estimate includes search and ramp, which this monthly salary model leaves out. I would also budget two hours a month per flat account for the agency-side wrapper. That is my planning assumption, not a rate or a measured service requirement. At ten accounts it means 20 hours to price at your team’s cost. Without that rate, I cannot honestly fold the wrapper into the $2,990 total and announce a final all-in winner.
The same restraint applies to capacity. A hire with ten accounts has no spare account seats in this model. A provider may offer more delivery capacity, but the table does not tell you how it handles a launch pile-up or a performance dip. You still own the client relationship and the decision about what good work looks like. If you need the resale side of the calculation, use the white-label margin table; if you need the operating case for keeping strategy in house, see white-label execution for agencies.
The tables support a decision, not a universal verdict on providers. On delivery price alone, flat wins every modelled row. The $500 minimum prevents percent-of-spend from beating $299 per account even with tiny clients. A hire can beat the percentage bill when spend is high enough, but does not beat flat within these 5-, 10- and 20-client comparisons. My call for overflow is flat white-label such as groas, with strategy and client ownership kept in house; I would hire for work that justifies the salary beyond cheaper fulfilment. Run the sheet twice: once for the clients you have and once for the clients you want. Then make the decision from your row, not from the invoice that happens to look familiar.