

 LinkedIn

A move from $30 to $120 CPM means four times the cost for the same number of impressions. To preserve ROAS, revenue from those impressions must also quadruple; “sales came back” does not tell me whether it did.
That is the problem with the reported account: CPM jumped, sales returned, and the tempting conclusion is that expensive delivery worked. It might have. It might also have brought back orders at economics the business cannot afford.
I would not tell an ecommerce advertiser to cut spend because an auction looks expensive. I would not tell them to keep spending because the checkout started making noise again, either. The decision sits between those reactions: what did the impressions produce, and what remained after the orders were fulfilled?
What the reported jump proves—and what it doesn’t
The report establishes a higher price for impressions, not a verdict on profitability. I have no purchase count, spend window, attribution setting or refund number. That is not a criticism of the advertiser. It is the boundary of the evidence.
Without comparable windows for spend, purchases, CPA and revenue, I cannot tell whether the account bought better buyers or just pricier delivery. Even “sales returned” leaves an important question open: returned compared with what period, at what spend?
Seasonal benchmarks offer context, but they cannot fill those gaps. The cited Rule1 sample shows the following Q4 progression:
| Period | CPM | What I can take from it |
|---|---|---|
| September 2025 | $19.96 | Starting point for this sample’s seasonal rise |
| October 2025 | $21.69 | Higher auction costs in the sample |
| November 2025 | $25.22 | A seasonal peak, not a quadrupling |
| Reported account | $30 → $120 | A much larger move, with the underlying account data unavailable |
The account figures are the report under discussion, not figures from the benchmark source. I cannot independently establish their window or comparability from the supplied information.
Other portfolio figures show year-over-year CPM moves from $15.07 to $17.01, about 13%, and $11.82 to $14.19, about 20%. Those are different portfolios, not a control group for this store.
The reported jump is much larger than those examples. That gives me a reason to inspect placement mix, audience size, frequency, creative fatigue, bid controls and the window after a relaunch. It does not identify which explanation is responsible. “It’s Q4” is context, not an account diagnosis.
The arithmetic: what must improve to preserve performance
The relationship is simple enough to keep outside a dashboard:
CPA = CPM ÷ purchases per thousand impressions.
ROAS = revenue per thousand impressions ÷ CPM.
These are the relationships behind the CPM hurdle. The examples below are arithmetic, not observed results from the reported account. Each row holds a different baseline constant to show what the higher impression price demands.
| Illustrative baseline | Required at the higher CPM to match it | If output per thousand stays unchanged |
|---|---|---|
| 1 purchase per thousand at $30 CPM = $30 CPA | 4 purchases per thousand at $120 CPM = $30 CPA | 1 purchase per thousand = $120 CPA |
| 2 purchases per thousand at $30 CPM = $15 CPA | 8 purchases per thousand at $120 CPM = $15 CPA | 2 purchases per thousand = $60 CPA |
| $90 revenue per thousand at $30 CPM = 3.0x ROAS | $360 revenue per thousand at $120 CPM = 3.0x ROAS | $90 revenue per thousand = 0.75x ROAS |
The distinction between purchases and revenue matters. More purchases per thousand preserve CPA. More revenue per thousand preserves ROAS. A larger basket can help the revenue calculation without rescuing purchase CPA, and neither calculation tells me what margin remains.
Free tool: the ROAS Calculator works out your return on ad spend, your break-even ROAS and the budget a revenue goal takes.
In a published illustration, a 3.0x baseline falls to about 2.44x after a 23% CPM increase, and about 2.16x after a 39% increase, with other inputs held constant. Apply the same arithmetic to the reported quadrupling and the baseline falls to 0.75x unless revenue per thousand rises alongside the price.
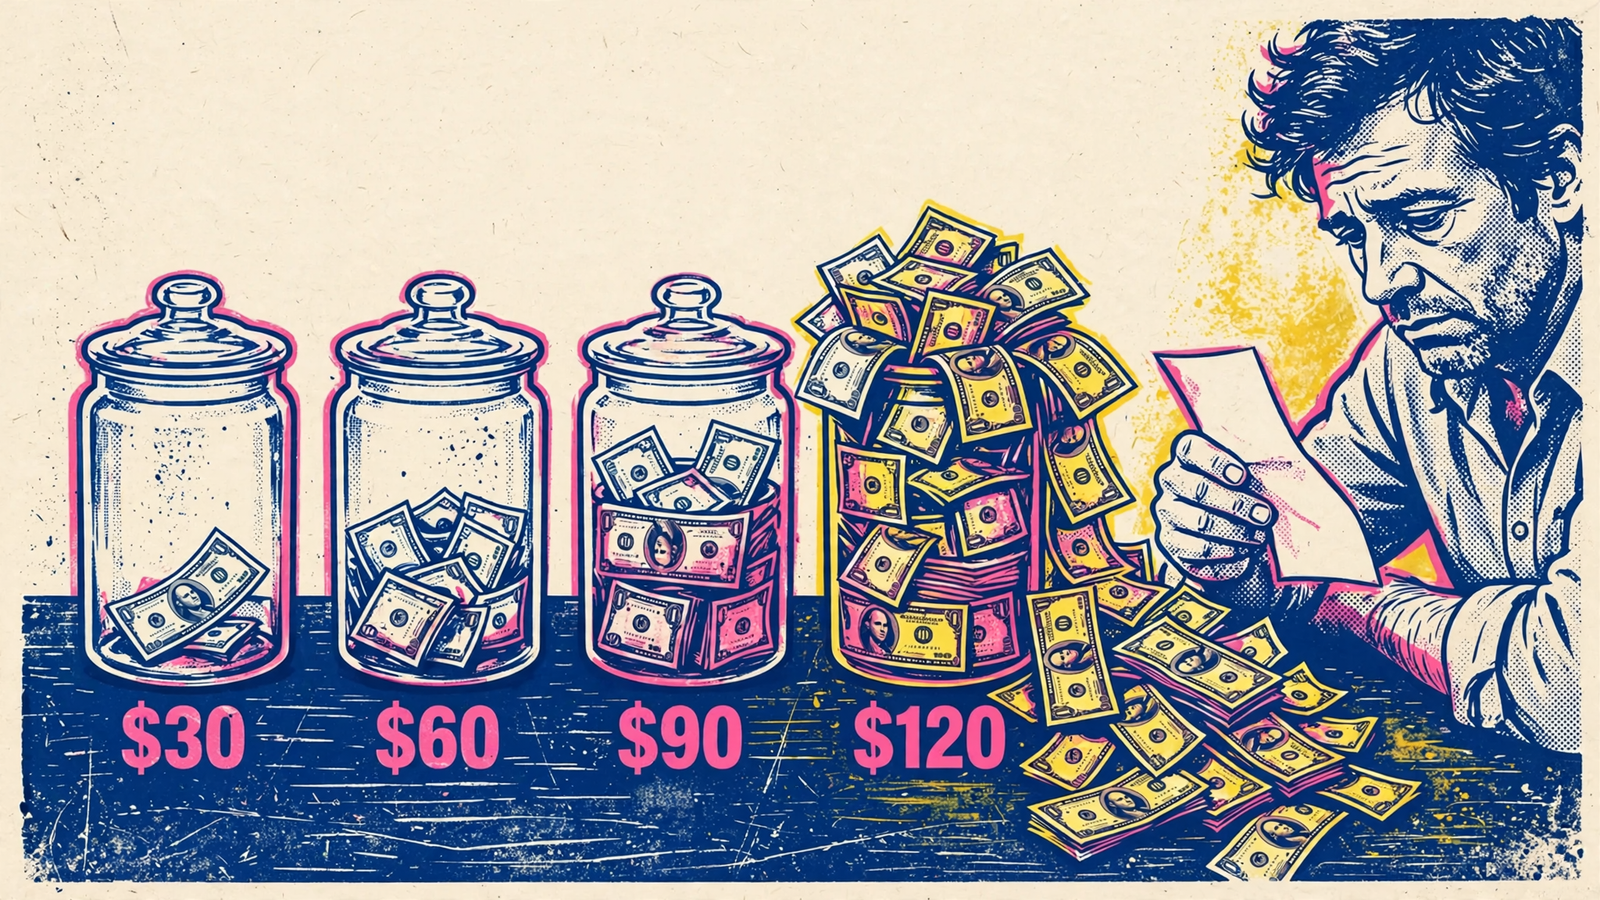
That is why I keep returning to the denominator. Sales can recover while the cost of acquiring each order gets worse. The checkout does not report the acquisition bill.
Quadrupling output is the hurdle for preserving the old CPA or ROAS, not a universal break-even rule. An account might tolerate worse performance and remain profitable. It might also preserve ROAS while discounts and costs destroy contribution. The business’s economics decide what is acceptable; the formula tells me what changed.
Expensive inventory can still earn its price
The useful distinction is between expensive impressions and deteriorating economics. A practitioner’s high-CPM, high-conversion versus high-CPM, low-conversion framework captures the point: an expensive audience that converts can deserve its budget. An expensive audience that does not convert needs attention.
But I would not use conversion rate alone to settle the case. I want the complete route from impressions to purchases and revenue. A reassuring percentage from one stage does not pay for weakness elsewhere.
There is also observed evidence that CPM and reported ROAS can rise together. In a Black Friday analysis, the CPM index reached 157, up 57% from October, while reported ROAS rose from 2.78 to 3.09. Stores increasing spend showed median ROAS gains around 35%.
The authors describe an observed pattern, not a causal result. It does not prove that spending more caused the improvement, that this store should do the same, or that higher reported ROAS meant higher profit.
What it does show is why a higher CPM is not, by itself, a reason to stop buying. The next question is whether the account’s output and contribution justify that price. Borrowing another set of stores’ recovery story is not an answer.
Three explanations fit the same headline
The same report—higher CPM, returning sales—can describe very different businesses. I would separate the explanations before changing the budget.
Better buyers cover the higher price
This is the kindest reading. Delivery shifts, the account reaches buyers who purchase more often or spend more, and revenue per thousand rises enough to cover the higher CPM.
The proof is improved output in a comparable window, not a story about premium inventory. I want purchases and revenue per thousand alongside the costs. If the account claims that better buyers justify the price, those buyers need to show up in the arithmetic.
Timing makes recovery look cleaner than it is
After a pause or relaunch, purchases from earlier clicks can land during the new reporting window. Attribution windows can also separate the timing of an ad interaction from the timing of an order.
That makes a short snapshot difficult to interpret. Spend has restarted, purchases are appearing, and the dashboard can make the sequence look tidier than the underlying journey.
Match the attribution settings and allow for purchase lag before comparing periods. I cannot assign the returning orders to the new delivery merely because they appear beside it on a chart.
Orders recover, but contribution does not
Sales can return while discounts, shipping, returns, fees and product costs consume the margin needed to support expensive acquisition. Platform purchase value does not settle that calculation.
This is where returning sales becomes a particularly expensive phrase. It describes activity without saying what the business keeps.
Reconcile revenue and costs before calling the recovery healthy. More order boxes are welcome. They are not a profit statement.
The evidence I need before defending the budget
I would not approve continued spend on the strength of those two reported facts alone. I would first ask for comparable windows: the same attribution setting, matching weekdays, and enough visibility into purchase lag to understand the comparison.
The account-level evidence should include:
- Spend and impressions, to establish the delivery price and volume.
- Purchase count and CPA, to show what happened to acquisition efficiency.
- Purchase value and ROAS, under the same attribution setting.
- Refunds and cancellations, to distinguish booked orders from retained revenue.
- New-customer share and contribution after costs, so repeat purchases or thinner margins do not hide deterioration.
A worked example shows why equal-spend comparisons help. This is illustrative arithmetic using the same CPM and CPA relationships, not additional evidence about the account:
| Illustrative period | Spend | Impressions | Purchases | CPA |
|---|---|---|---|---|
| Lower-CPM period | $600 | 20,000 | 20 | $30 |
| Higher-CPM period | $600 | 5,000 | 8 | $75 |
Purchases are happening in the higher-cost period. Yet the same spend buys fewer orders, and CPA more than doubles. Without purchase counts and spend, “sales returned” conceals exactly the distinction the manager needs to explain.
The reverse is possible too: better purchase yield could cover the higher price. The point is not to presume failure. It is to stop treating a sales notification as the analysis.
Use blended revenue as a cross-check, not a causal verdict
Next I want the business’s own revenue records. I would pull Shopify or Stripe revenue for the same dates, account for refunds and cancellations, and compare it with total ad spend.
That produces Marketing Efficiency Ratio, or MER: total revenue divided by total ad spend. I would keep that denominator consistent across periods rather than quietly switching between ad spend and broader marketing costs.
MER checks the business-wide revenue-to-spend relationship; it does not attribute revenue to Meta. If it holds while platform ROAS falls, the disagreement deserves investigation. It does not prove Meta is still working. If MER falls while the platform looks healthy, I want to know why before accepting the platform’s version of events.
The distinction matters because platform attribution can include overlapping demand, cross-channel effects and purchases that might have happened anyway. The limitations are explored in where Meta’s ROAS number actually comes from. I would reconcile the reported revenue with backend records rather than apply a blanket adjustment and call the job done.
For the causal question—what revenue would disappear without the spend—I want a holdout or matched-market test. Pausing or reducing spend in a subset of regions or a holdout group, then comparing against the rest, addresses a different question from dashboard reconciliation.
Even then, I would not turn a simple before-and-after revenue gap into a precise incremental return. The comparison needs to support that conclusion. Use reconciliation to check the books and a holdout to investigate incrementality. They are not interchangeable jobs.
What a ROAS-focused manager should show—and what I would decide
I do not hire a manager to make CPM look respectable. I hire them to protect acquisition economics and contribution. For this account, that means showing the comparable periods, explaining the gap between platform and backend revenue, and stating what evidence supports the next budget decision.

The recommendation should fit one of these cases:
| Decision | Evidence that supports it |
|---|---|
| Keep spending | Purchase yield or revenue per thousand supports acceptable economics, and backend revenue and contribution support the case. Matching the old performance requires the output increase established above. |
| Cut or fix | CPA worsens beyond what the business can support, or retained revenue and contribution fail to justify the spend. Returning orders do not override that evidence. |
| Investigate before committing | Attribution windows differ, purchase lag clouds the comparison, or platform results and blended business results disagree. |
I want the manager to name what remains unknown, too. “We need comparable purchase counts” is useful. “The algorithm is finding premium customers” is a hypothesis wearing a blazer.
This is the accountability I want from groas: clear checks on spend, purchase rate, MER and contribution, with changes and their reasoning logged rather than reduced to a weekly cost alert. The standard is an explainable budget decision, not a comforting screenshot.
My conclusion on the reported jump is narrow because the evidence is narrow. The arithmetic establishes a fourfold output hurdle to preserve CPA or ROAS. It does not establish that the account cleared it, that the orders were incremental, or that the business retained enough margin.
Do not cut because CPM rose. Do not keep spending because sales returned. Keep spending when comparable performance and contribution justify the price; cut or fix when they do not. Expensive impressions can be worth buying. Returning sales alone do not tell me they were.


