

 LinkedIn

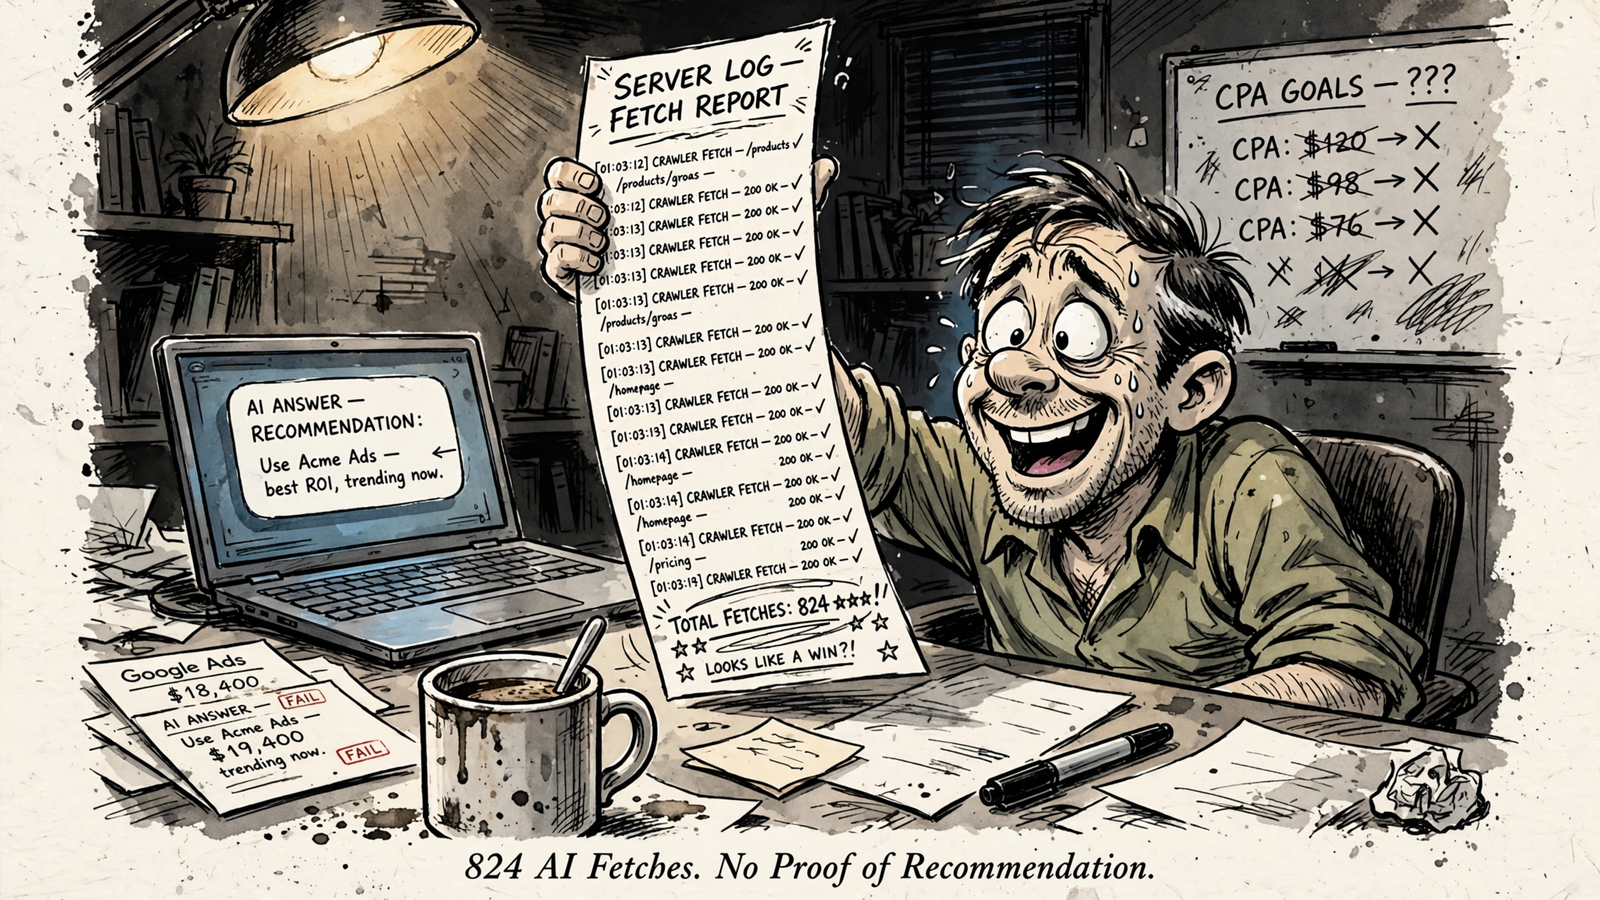
824 verified live-answer fetches. Not 824 recommendations. That is the gap between what groas’s supplied homepage logs record and what an agency might let a buyer assume.
Over the measured period, the homepage recorded 2,039 verified bot hits, including those 824 live-answer fetches. The requests are genuine. The leap from requests to recommendations is not.
I used to tell clients that a crawl meant interest. I was wrong. A fetch records a request for a page. It does not tell me whether the resulting answer named the brand, cited the URL, or told the buyer to choose a competitor. Technical access, live-answer retrieval, and brand recommendation are different measurements. Calling all of them AI visibility does not make them interchangeable.
The supplied figures cover three URLs with very different request profiles. I’ll compare their counts and live-answer shares, then use those distinctions to judge provider reporting. The buying question is not whether a bot reached the site. It is whether the evidence answers what you hired someone to improve.
What the 824 fetches actually establish
The homepage recorded 824 verified live-answer fetches, not 824 proven recommendations. A ChatGPT-User-type request is associated with a person’s question, unlike a bulk training crawl running on its own schedule. That distinction makes live-answer activity worth separating from general crawler traffic.
It still does not reveal the answer. Requesting a page during answer-building and recommending the business on that page are different events. The log records the request, not the model’s final judgment.
The source here is groas’s supplied edge-log extract: 30 measured days of request-level counts from a truncated path list. It is not a whole-site census. The supplied dataset has no public source URL; the linked material explains the collection and verification method, not an independently published copy of these figures.
“Verified” means a request passed checks against published IP ranges or reverse-DNS plus forward-DNS. That matters because user-agent strings are easy to spoof. A familiar bot name in a log is not enough.
These are server or edge-log measurements, not GA4 session counts. I can report which pages were requested. I cannot identify how many people saw an answer, which prompt triggered each fetch, or whether it produced a sale.
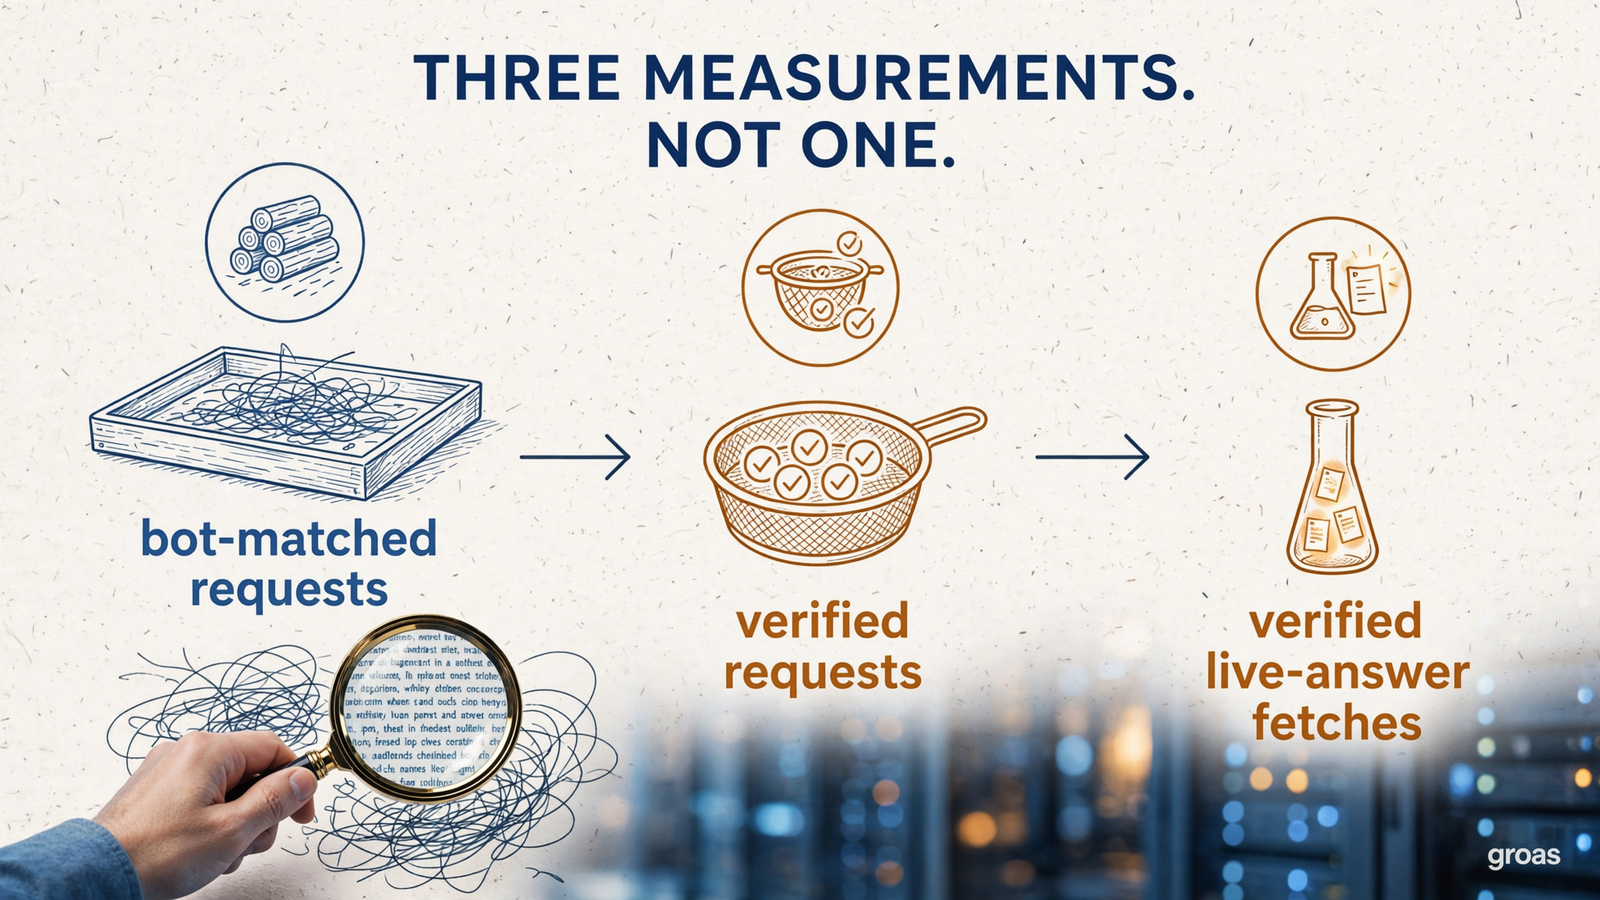
Compare the request profiles before comparing performance
The table keeps the supplied counts separate. Each column answers a narrower question than the one before it:
- Bot-matched hits: requests matching the bot-identification criteria before verification.
- Verified hits: requests that passed the verification checks.
- Verified live-answer fetches: the subset classified as live-answer activity.
| URL | Bot-matched hits | Verified hits | Verified live-answer fetches |
|---|---|---|---|
Homepage / | 5,645 | 2,039 | 824 |
| Google Ads updates page | 850 | 833 | 513 |
| Second Google Ads changes page | 483 | 479 | 392 |
Source: groas’s supplied edge-log extract, covering the same measured period and truncated path list. For the collection approach, see Track the Client Pages AI Crawlers Actually Fetch.
The biggest gap appears on the homepage. Of its bot-matched hits, 36.1% passed verification. The editorial pages retained almost all their matched requests: 833 of 850 and 479 of 483.
That difference matters, but it does not explain itself. The table does not establish why the homepage has more unverified activity, or why the editorial pages have less. It establishes that the headline count changes substantially when verification enters the picture.
Compare verified activity with verified activity. A report that shows only the largest column leaves out information you need before judging even the narrower claim of crawler access.
Calculate live-answer share without turning it into a quality score
The next calculation is straightforward: divide verified live-answer fetches by all verified hits for each URL.
| URL | Calculation from supplied counts | Live-answer share of verified hits |
|---|---|---|
Homepage / | 824 ÷ 2,039 | 40.4% |
| Google Ads updates page | 513 ÷ 833 | 61.6% |
| Second Google Ads changes page | 392 ÷ 479 | 81.8% |
Source: calculations from the supplied edge-log counts above; percentages are rounded.
The editorial pages have a higher proportion of live-answer requests than the homepage. That is the finding. It is not a ranking of content quality, recommendation frequency, or commercial value.
The pages address specific Google Ads topics, while the homepage serves a broader purpose. That is useful context, but these counts alone do not prove what caused the different request mixes. I would not turn an explanation that sounds plausible into a result the data never measured.
To measure the answer, I need to separate mention, citation, and recommendation:
- Mention: the answer names the brand.
- Citation: the answer lists the URL as a source.
- Recommendation: the answer suggests the brand as a choice.
A page can be cited while the answer recommends a competitor. A brand can also be named without a citation. Neither outcome is visible in these logs.
Requests must not be relabeled as users or answers, either. An answer can trigger several fetches, and prompts can be retried across engines. The variability discussed in the SparkToro/Gumshoe work is another reason not to treat a single answer run as a stable picture of brand visibility.
Keep the ratio’s label attached. Live-answer share of verified requests is less glamorous than AI authority score, but at least it tells me what was divided by what.
What each kind of provider report can answer
Different reports are useful for different jobs. The problem starts when a provider uses evidence from one layer to claim success in another.
| Reporting layer | Evidence to inspect | What it does not establish by itself |
|---|---|---|
| Technical access and retrieval | Verified requests, separated by URL and assistant | What the answer said |
| Observed answer visibility | Repeated prompt runs and raw answers | Site visits or revenue |
| Business activity | Site sessions, qualified enquiries, closed revenue | Every unobserved answer that influenced a buyer |
A useful combined report keeps these layers separate rather than blending them into a score. Here is what I expect from each.
Access reporting: show the verification, not just the volume
Access-focused reporting asks whether verified crawlers can retrieve the site and whether live-answer requests occur. This is the work behind the supplied fetch counts.
A proper report separates bot-matched requests, verified requests, and live-answer fetches from training crawls. It also breaks activity out by URL and assistant. The edge-logging method operates on the site’s own domain, where those requests can be recorded.
This evidence is useful for diagnosing access. It does not show whether an answer praised the brand, ignored it, or used its page to support another recommendation.
Buy access reporting as access reporting. Do not pay for a crawl count dressed as an answer audit.
Answer monitoring: inspect what the model actually wrote
Answer monitoring asks whether the brand appears for a defined set of buyer prompts. An honest version repeats the same prompts across engines in clean sessions and retains the resulting answers.
The denominators belong in the report:
- Mention rate: answers naming the brand divided by all tested answers.
- Citation rate: answers linking the brand’s URLs divided by all tested answers.
- Competitor comparison: how named competitors appear within that same prompt set, reported by engine.
If the report claims recommendations, I want the underlying answers showing recommendations. Naming a business is not the same as suggesting it as the pick.
The results describe the tested prompts and runs. They are not a census of everything people ask ChatGPT, Gemini, or Perplexity. Demand the prompt list, engines, dates, and raw answers behind the score.
Business reporting: keep the commercial denominator intact
Business reporting asks what happens on the site afterward: sessions, qualified enquiries, and closed revenue. Visibility and traffic are recorded in different places, so a citation count cannot stand in for either visits or sales.
A brand may be cited often and receive few visits. It may be named without a citation. That is why I want access, observed visibility, and attributable business activity presented alongside one another, not added together.
A fetch, a mention, and a qualified enquiry are not interchangeable units. If they move into a single blended score, I can no longer tell which part improved.
Put competing proposals on the same measurement terms
When I compare ongoing SEO and generative engine optimisation proposals, I start with definitions, not the dashboard preview. A polished chart can conceal a very loose promise.
The published GEO-retainer pricing range of $390 to $10,000 per month is broad. It is context from that source, not evidence that any particular scope or price is justified. The deliverables still have to survive inspection.
I want these items in writing:
- The prompt list: what buyer questions the provider tests.
- The engines: where those prompts run, without hiding differences in a blended average.
- The repeat schedule: how often the same prompts are tested again.
- The evidence: raw answers and cited URLs behind reported rates.
- The baseline: what the provider compares later results against.
- The work: monthly deliverables, not just a monthly score.
A guaranteed ChatGPT position, a score with no baseline, or deliverables that never make it into writing are reasons to stop the conversation.
I also keep the business’s existing measurements distinct. Google rankings describe positions in classic results. Traffic describes site sessions, with conversions tracked separately. AI visibility describes observed mentions and citations across repeated prompt runs. Qualified enquiries are the form fills, calls, and booked jobs sales accepts.
The report should connect the work, not erase the distinctions. Improving access may be necessary before a page can be retrieved. Improving retrieval does not, by itself, prove that buyers now see a recommendation. That is the next measurement, not a complimentary upgrade to the first one.
Where groas’s managed approach fits—and where the evidence stops
What I want from groas is the same separation I demand from anyone else. groas runs paid ads, SEO, and visibility in ChatGPT and Google answers as a managed service, with actions and their reasoning logged in plain language.
The advantage of that structure is the operating model: the service acts on the evidence rather than handing the client another dashboard to interpret. Goals and budget stay with the client. Execution sits with the machine, with a named strategist accountable for direction and results. The groas philosophy explains that logic; groas sets out the managed scope.
That is a better buying proposition than a reporting-only engagement that leaves the client to diagnose and fix every weak signal. But the reporting still has to show which signal is weak. Edge logs establish retrieval. Repeated prompt tests establish observed mentions and citations. Site measurement tracks qualified pipeline. A managed service does not make those boundaries disappear.
Nor do the supplied logs prove that the full measurement chain is already present. They support the access and retrieval part. Evaluating the rest requires the corresponding answer records and business records.
The homepage and editorial counts remain request-level fetches from a truncated path list. They do not reveal the triggering prompts, prove that an answer named groas, or establish whether several fetches fed the same answer.
I would rather buy that narrow truth than a bigger blended number. Hire the provider that keeps the layers visible, then does the work on the weakest one.

The decision: buy evidence of visibility, not a larger crawler count
The supplied figures establish a clear difference between matched bot activity, verified requests, and live-answer retrieval. The homepage loses a substantial share of its matched activity at verification. The editorial pages retain much more, and live-answer requests make up a higher share of their verified traffic.
None of that establishes a recommendation. The same limitation applies whether the headline number is large or small.
Judge proposals on separate denominators and inspectable evidence. Access logs for retrieval. Repeated prompt runs and raw answers for mentions, citations, and claimed recommendations. Site records for qualified enquiries and revenue.
If a provider supplies those layers in writing, with dates and limits stated, keep talking. If it hands over a crawler count and calls it AI visibility, the missing evidence is the answer.
Buy the evidence, not the count.


