

 LinkedIn

An AI visibility score of 87 tells me nothing until I can see the prompt set, the denominator, and the conditions behind it. A green arrow and “up 12 points” are decoration if the report cannot explain what changed.
I read these reports the way I read Search Terms reports: the score is the conclusion, not the evidence. Before looking at a chart, I ask for three things:
- The full prompt list.
- A raw export with dates, engine labels, and repeat runs.
- The definition and denominator behind each rate.
Then I read the report backwards, starting with the appendix. This baseline method lays out a fixed prompt panel and repeat runs you can copy.
The glossary below follows the order I audit the measurement: what was asked, how answers were collected, what counted as a win, and whether any of it connects to work or revenue. No denominator, no decision.
Prompt set
A prompt set is the fixed list of questions used to test what AI engines say about your brand and market.
The prompt list defines what the score can tell you. A panel full of questions about your company is not a test of whether buyers discover you in a category. It is a test of what happens when someone already knows your name.
A workable setup uses 20 to 40 prompts, with 3 to 5 runs per engine. StorKim’s monitoring method uses that discipline. Keep the list fixed when measuring a trend; otherwise, a better score may just mean easier questions.
Ask to see the prompts before admiring the line chart.

Prompt class
A prompt class groups questions by the job they do, such as branded research, category discovery, comparison, or purchase-stage research.
The deck calls all of this visibility. I call it four different problems:
- Branded: “Is Acme CRM good for agencies?” tests how the engine describes your positioning.
- Category: “Best CRM for agencies” tests whether you enter the consideration set.
- Comparison: “Acme vs Beta” tests how you appear head to head.
- Purchase-stage: “Acme pricing for 20 seats” tests whether the answer supports a buying decision.
Ask for the class split before acting on the average. Winning branded questions does not tell me whether unfamiliar buyers can find you.
Commercial relevance
Commercial relevance is how closely a prompt connects to a potential buying decision.
The misuse is padding the panel with trivia you already win. “Who founded Acme?” might produce a lovely answer. It does not do the same job as “best CRM for agencies.”
I put more weight on category and purchase-stage prompts because those questions sit closer to a purchase. Make the vendor identify which 10 prompts map to money, then judge those first. A high average across low-value questions is still a low-value result.
Observation
An observation is one answer to one prompt on one engine at one recorded time.
Not a ranking. Not a durable position. One answer.
“ChatGPT recommends us” often means someone asked once on Tuesday and liked the result. That screenshot is an observation, not evidence of a stable recommendation pattern. Promptwatch’s explanation of prompt sampling describes why repeated answers can vary.
Count observations before interpreting rates. A report should let you trace each result back to the prompt, engine, date, and run that produced it.
Repeat run
A repeat run asks the same prompt again under the same conditions to check how consistently an answer appears.
These systems produce variation, and personalization, memory, and the collection path can also shift the output. Answers collected through an API can differ from those shown in the product. “We tested ChatGPT” leaves quite a lot unsaid.
I use 3 to 5 runs per prompt per engine and keep the counts visible. A mention in 4 of 5 runs is different evidence from a mention in 1 of 5. Neither needs to become a mysterious score.
Ask how many runs sit behind every cell. Without that, you cannot judge how much confidence to put in a change.
Collection conditions
Collection conditions are the recorded settings and circumstances under which an answer was collected.
I want these alongside the results:
- Engine and mode.
- Date.
- Country and language.
- Signed-in state and personalization settings.
- Model version, where available.
- Collection path: product interface or API.
Different engines retrieve and present information differently. Blending their answers without labels hides those differences rather than measuring them.
Every rate needs an engine split and a date range. Otherwise, I cannot tell whether the brand improved or the collection setup changed. “Same question” is not enough if everything around the question moved.
Mention rate
Mention rate is the share of tested answers that name your brand.
Say I test 40 prompts with 3 runs each. That produces 120 observations. If the brand appears in 30 answers, its mention rate is 25%.
Keep the unit consistent: answers containing a mention divided by all tested answers. Do not count answers in the numerator and unique prompts in the denominator.
The next problem is what qualifies as a mention. A competitor comparison that names you only to dismiss you still contains your name. So does a disclaimer at the bottom.
Get the coding rule in writing, then read five counted answers yourself. A string match can establish presence. It cannot establish approval.
Citation rate
Citation rate is the share of answers with visible sources that link to your owned domain.
That is the denominator used in Sona’s repeatable measurement method. It is not the same denominator as mention rate, and the two should not be quietly treated as interchangeable.
An engine can recommend your business using a third-party review and cite that review instead of your website. Your mention rate could be 40% while your citation rate is 5%. Both can be correct.
A citation measures a source relationship, not necessarily an endorsement. Before buying work to “improve citations,” establish whether the problem is missing sources, missing recommendations, or both.
Recommendation rate
Recommendation rate is the share of tested answers that position your brand as a viable choice.
This needs a judgment rule, not just a brand-name search. Being named in a list does not automatically establish endorsement. Being explicitly shortlisted for the buyer’s stated needs is clearer evidence.
I want the report to distinguish a passing mention from a recommendation and show examples of each. Otherwise, a change in labeling can look like a change in performance.
Ask to audit the recommendation coding. If the vendor cannot explain the distinction, run this mention audit and bring your own examples to the call.
Source URL
A source URL is the exact link an answer presents as a source.
The exact page matters. “Reddit was cited” is less useful than knowing which thread appeared and what it says about the business.
Keep the page-level link in the export. A domain summary is convenient for a dashboard; it is not enough to investigate the answer.
Cited domain
A cited domain is the website that owns a source URL shown with the answer.
Your business can be recommended while a review site or Reddit receives the citation. That is not an owned-domain citation, even if the cited page is entirely about you.
Separate your domain from third-party pages about your brand. Those are different outcomes, and reporting them as one total makes the next decision harder.
Attributed brand
An attributed brand is the business the answer actually recommends, which may differ from the owner of the cited source.
Imagine an answer that recommends a home services business but cites a review site. The business receives the recommendation; the review site receives the citation. Neither fact cancels the other.
This is where I resist the automatic prescription of “better schema.” The answer may already understand the business and be drawing its evidence elsewhere.
Read the recommendation and its sources together before choosing the fix. A missing link to your website does not, by itself, diagnose a technical problem.
Share of voice
Share of voice is your brand’s mentions divided by all mentions of a fixed competitor set across the same prompts, engines, and period.
It measures your share within that panel, not how much of the entire market you cover. The competitor list is part of the denominator, so changing it changes the meaning of the number.
I keep raw counts beside the ratio. Moving from 4 mentions to 6 means something different when the total pool also shrinks from 40 to 20.
Lock the comparison set before tracking the trend. Layer3Labs’ measurement guidance makes the same practical point: keep the panel stable and break results out by engine.
Comparability
Comparability means two measurements were collected in sufficiently consistent ways to support a useful comparison.
Same prompts, same competitors, same collection conditions, same counting rules. If those change, I need to see where the series breaks rather than watch a smooth line pretend nothing happened.
If the panel changes, restart the trend or clearly separate the series. A prettier chart is not a reason to compare different tests.
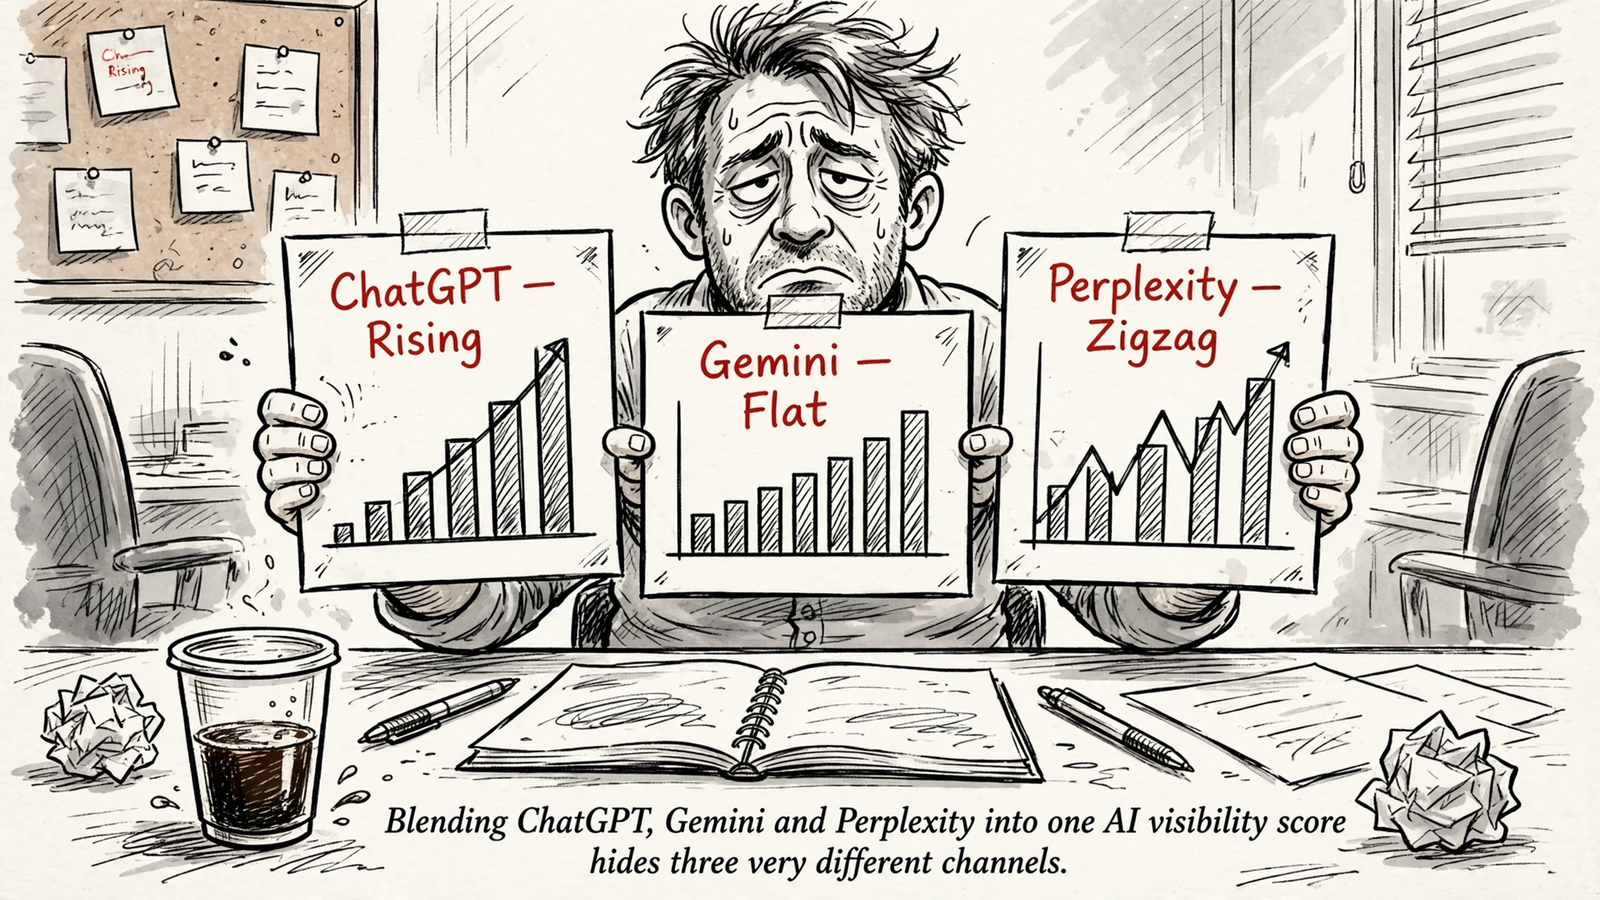
Volatility
Volatility is how much the observed answers move across repeat runs or measurement periods.
Buyers read movement as progress. The report needs to establish whether that movement is more than ordinary variation.
Take the same prompts and three runs: two mentions on ChatGPT, none on Gemini, three on Perplexity. Those are different results worth investigating separately, not an invitation to hide them inside one average. Three runs also do not establish a permanent verdict on any engine.
An aggregate adds another question: how is each engine weighted? Is ChatGPT 60% of the score because of the audience you care about, or does each engine receive equal weight?
Publish the weights and the engine-level counts, or skip the average. I want to know where the movement happened before deciding what to do about it.
Referral
A referral is a visit your analytics can identify as coming from an AI answer.
It is a traffic measure, not a visibility measure. An answer can name or recommend your business without sending a visit your analytics can identify.
Copied links, later branded searches, and visits that arrive without usable referral information complicate the picture. That is why I treat identifiable AI referrals as a floor and want survey self-attribution beside them.
Keep the referral count separate from the answer count. They describe different stages, and neither substitutes for the other.
Conversion
A conversion is the action you count after a visit, such as the outcome being tracked in your analytics.
Before comparing conversion rates, I want the report to name that action and show the visits behind the calculation. Otherwise, “AI traffic converts” can become another polished claim with its denominator missing.
A visibility gain is not a conversion gain. Show the path between the two before putting them in the same success story.
Attributable revenue
Attributable revenue is revenue you can defensibly connect to the activity being measured.
The difficulty is attribution plumbing, not just campaign performance. A recommendation, a later branded search, and a purchase may belong to the same buying journey without appearing as one neat sequence in the report.
I keep visibility rates and revenue in separate tables until the connection is supported. Do not sell visibility evidence as revenue proof. Someone will build a budget around a promise the measurement never made.

Monitoring tool
A monitoring tool records what the engines say across a defined set of tests.
It owes me a stable panel, repeat runs, disclosed collection conditions, and an export I can audit. That is useful work. It is not the same as changing the website, content, or third-party evidence the engines may use.
A dashboard is a measurement system, not an execution record. Judge it on whether it makes the observations inspectable, not whether the headline number looks reassuring.
Managed execution
Managed execution is the work of making and recording changes intended to improve the measured results.
The line is where work leaves the dashboard. I expect an owner, a shipped change, and a before-and-after read on the same prompts. That comparison does not magically prove causation, but it gives me something to investigate beyond two adjacent dates.
When a deck shows citations moving without showing what shipped, it is monitoring sold as optimization.
My minimum handover is concrete:
- Sample export: prompt text, engine, date, run number, and mention, citation, and recommendation coding.
- Change log: dated site, content, or third-party changes.
- Owner: who investigates a miss and who ships the response.
Map the metric to someone’s work. Otherwise, the chart becomes the deliverable.
AI visibility score
An AI visibility score is a single headline number that combines selected visibility measurements.
It is also the term I would retire.
One prompt panel becomes a hidden sample. Different engines become an average. Mentions, citations, and recommendations become a blended count. Unless those choices are visible, the number can move without explaining anything useful.
I keep the underlying rates, split by engine, with dates, raw counts, and denominators. I delete the headline.
If a vendor or agency cannot show the prompt set, repeat runs, and collection conditions behind the score, they are selling the conclusion without the evidence. If they are selling execution too, I want the change log.
Demand the denominator, or keep your budget.


