

 LinkedIn

Two AI visibility reports can give the same brand 78% and 35% in the same week without either provider lying. They just ran different tests.
The fact everything else follows from is simple: an AI visibility percentage describes a measurement setup, not a universal score for your brand. At its simplest, it is qualifying appearances divided by answer opportunities in the sample. Change the questions, engines, repetitions or definition of an appearance, and the score can change without anything changing about the brand.
Before I compare tools, I compare their denominators. Here is how I work backward from the percentage to what it actually tells me.
Start with the questions, not the percentage
Say the business sells standing desks under the name ApexDesk. I want to know how often ChatGPT recommends it. I cannot treat generated answers like a stable list of search positions. The useful starting point is a fixed panel run on a schedule: controlled questions, repeated over time, with appearances counted across the sample.
For the running example, I start with ten prompts aimed at the same buyer:
- Three branded prompts, such as “Is ApexDesk good for back pain?”
- Three category prompts, such as “Best standing desk for small apartment.”
- Four purchase-intent prompts, such as “Standing desk under $500 with free returns, which should I buy?”
That is the prompt panel. For one run on one engine, it produces ten answer opportunities. Everything that follows changes what 40% or 80% means without necessarily changing whether any real buyer discovers the brand.
Separate recognition from discovery
Branded prompts nearly always mention the brand. Ask “Is ApexDesk good?” and ApexDesk is already in the question. Category and purchase-intent prompts ask the model to choose it without that hint.
That is why blending branded prompts into overall visibility can flatter the result. Suppose ApexDesk appears in all three branded answers and one of the seven unbranded answers. The combined rate is 40%, but it hides the useful distinction: 100% on branded prompts and about 14% where the buyer has not named a brand.
Recognition and discovery belong on separate lines. I want to know both, but I do not want one disguising the other.
Attach the engine, market and dates
The same ten prompts asked in ChatGPT and Perplexity produce different measurements. The question format matters, too: a short seed keyword for AI Overviews is not the same test as a full prompt for AI Mode or ChatGPT.
Location and observation time also belong beside the result. “40% visibility” is incomplete. “40% across this prompt panel, on these engines, in this market, during this week” is something I can begin to interpret.
I do not file a visibility report unless its setup lists the prompt count, engines, market and dates.
The denominator decides what the percentage means
Back to ApexDesk. Four appearances across ten answers gives me 40%. The arithmetic is simple. The meaning depends on the list.
Four appearances on purchase-intent questions describe a different result from four appearances when three questions already name the brand. The latter is mostly a receipt confirming that the model can spell ApexDesk.
This is how a score can improve without buyer discovery improving. Adding easy or branded prompts can inflate the percentage without changing what engines say. The measurement moves because the test changes.
Expanding a panel to “cover more ground” is not automatically wrong. Mixing the expanded panel into the old trend line is the problem. If I add questions, I need to keep the original set visible so I can distinguish a change in answers from a change in the exam.
Freeze the comparison panel, and report additions separately. For this example, I hold the ten-prompt set for a month and keep branded and unbranded rates apart.
Why two providers’ percentages may not be comparable
Imagine two providers testing ApexDesk:
| Measurement choice | Provider A | Provider B |
|---|---|---|
| Prompt panel | 50 prompts, half branded | 20 unbranded purchase prompts |
| Engines | ChatGPT only | ChatGPT, Gemini and Perplexity |
| What counts | Any name match | A top-three recommendation |
Both can send a perfectly tidy percentage. Those percentages share a label, not a measurement specification.
I also need the repeat count and the way results are combined. Without those, I cannot tell whether the score describes one batch of answers or a pattern across repeated runs.
A higher score from a softer setup is not better visibility. A defensible comparison uses identical prompts, engines, markets, scoring rules and observation periods, with the same number of repeats. Otherwise, the exercise mostly reveals who wrote the kinder test.
Define the hit before counting it
Even with the denominator fixed, I still need to know what goes in the numerator. A tool reports 60% visibility. What happened in those answers?
These are three different observations:
- A mention puts the brand name in the answer text.
- A citation shows a page as a source.
- A recommendation presents the brand as a choice for the buyer.
They do not always travel together. In one 30-prompt test, 11 tools were mentioned, but four never had their own sites cited. Another tool was cited once without being named.
For ApexDesk, a citation without a mention does not establish that the answer introduced the brand by name. A mention without an own-domain citation may rely on a review site or Reddit thread that also discusses competitors. A recommendation tells me something different again: the answer has put ApexDesk forward as an option.
None of these observations, by itself, proves a sale. They tell me what appeared in the answer, not what happened afterward.
Count mentions, citations and recommendations separately. I also split citations into links to the brand’s own domain and links to third parties. One blended “visible” flag throws away the distinction I need to decide what to fix.
Repeat the test before calling it a position
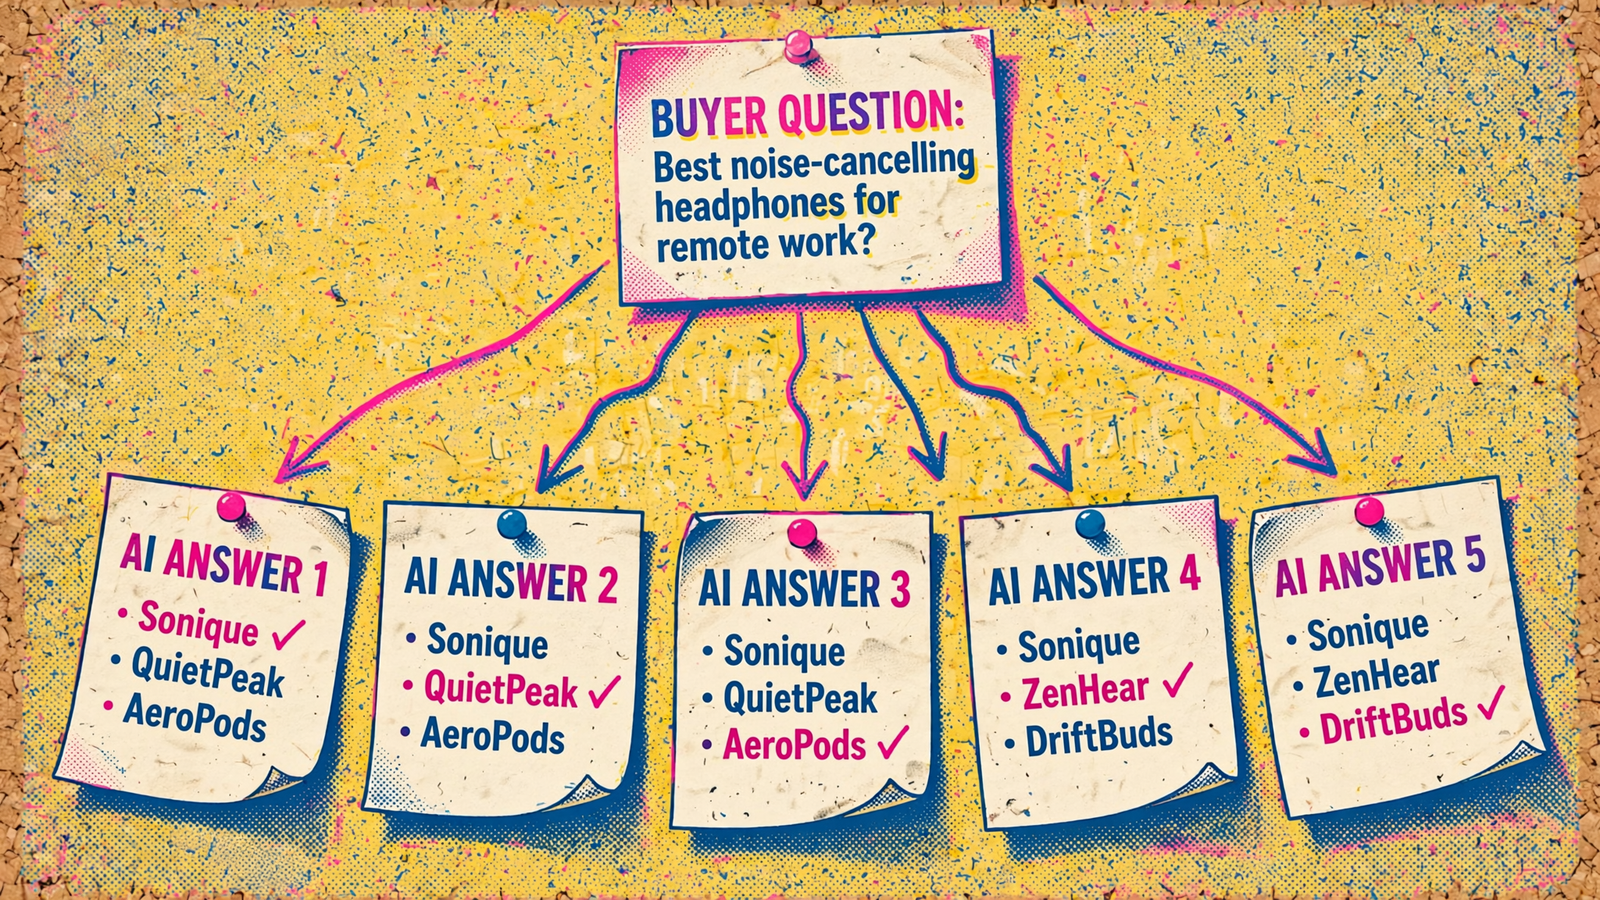
A fixed panel and clear scoring rules still do not make one answer a stable ranking. Generated answers vary, so the same prompt can produce different shortlists on repeated runs.
Volunteers ran prompts 2,961 times across ChatGPT, Claude and Google AI. The same brand list came back fewer than one in 100 times; the same order returned about once in 1,000. A single answer tells me what one draw looked like, not where a brand permanently ranks.
Citations change over time, too. Re-running identical prompts a month apart changed cited domains by 40.5% on Perplexity and up to 59.3% on Google AI Overviews. Another study, covering more than 43,000 keywords, found AI Overviews averaged 2.15 days before their content changed.
One answer is a sample, not a position. As a practical starting point, I repeat each prompt at least three times per week and report the observed range rather than presenting one run as the result.
Show the variation without dressing it up as certainty
Three repeats do not give me a confidence interval worth framing. They give me a first look at variability.
Suppose ApexDesk appears in one of three runs for a prompt on Monday and two of three on Friday. I report those observations as 1/3 and 2/3, with their dates, rather than compressing them into a reassuring 50% and hiding the movement.
For a baseline, I hold five prompts unchanged for four weeks and watch the weekly share. A movement that persists across three weeks of repeated runs is more persuasive than a one-week jump. Neither is a reason to stop checking the underlying answers.
I cover that discipline in more detail in Your AI Visibility Score Is a Sample, Not a Ranking, including the repeat counts and baseline setup I use to separate a trend from run-to-run wobble.
Keep the raw observations beside the summary. A range is useful only when I know what produced it.
Use crawler logs to explain gaps, not claim visibility
Once the answer measurements are clear, crawler logs can help explain what happens before inclusion. They cannot replace the answer measurements.
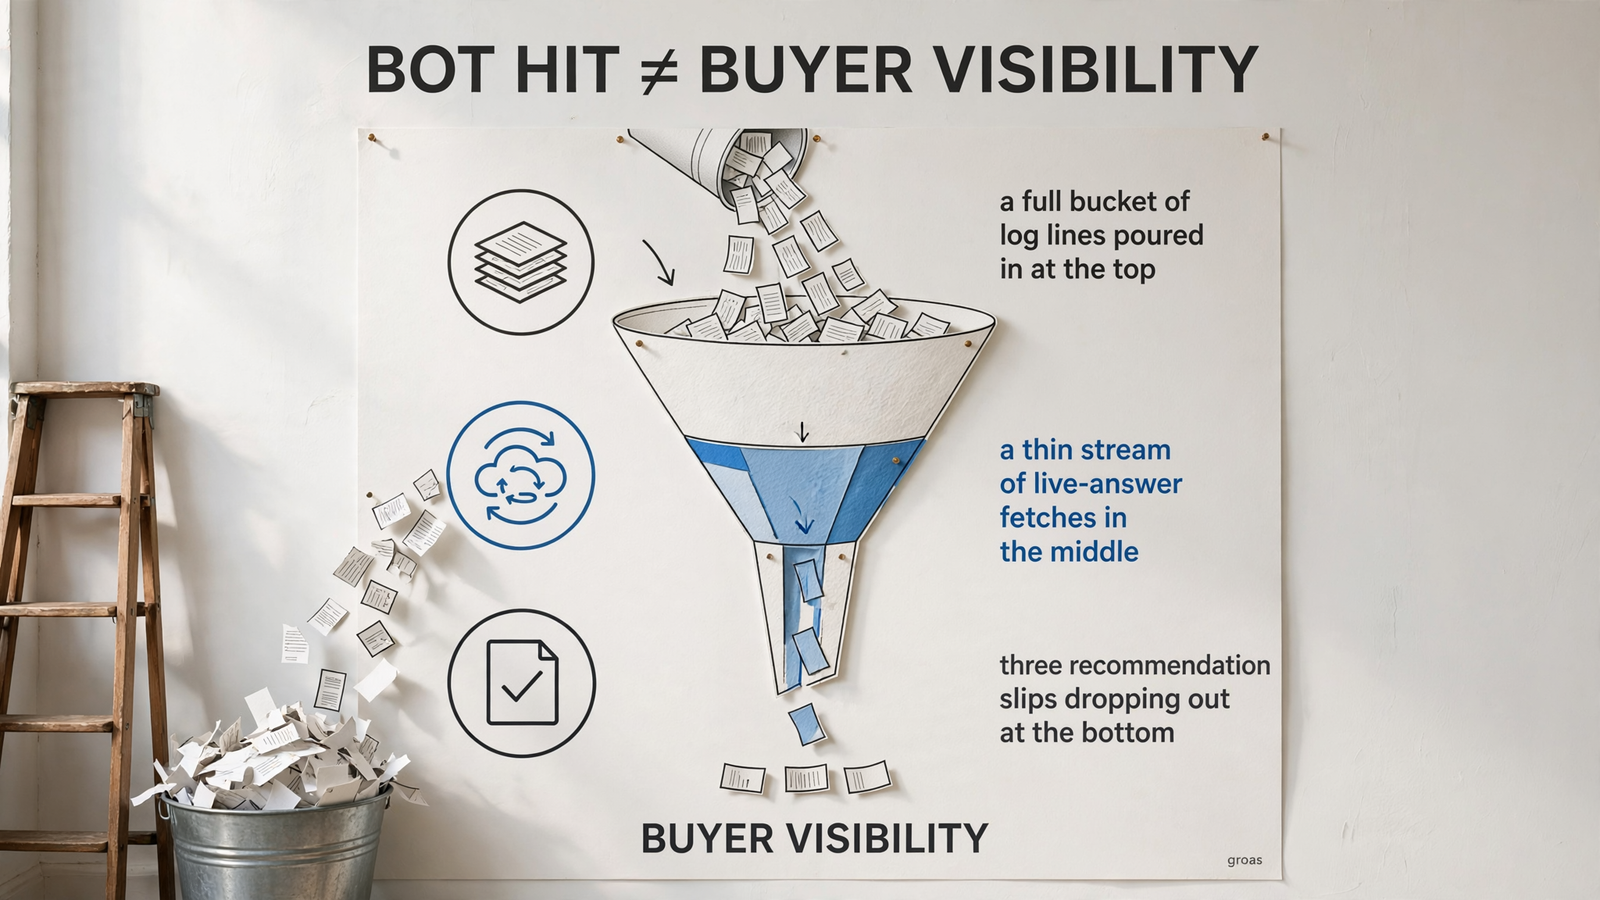
Server logs show AI bots fetching pages, but training crawl is not live retrieval. GPTBot collects content that may be used for training. ChatGPT-User is associated with user-triggered fetching. Those are different activities, and counting them together produces another flattering number with an unclear meaning.
For ApexDesk, hundreds of training-crawler hits do not establish that a product page appeared in a buyer’s answer. Equally, the absence of an observed live fetch does not, by itself, prove the brand was absent from every answer.
A fetch proves a fetch, not a recommendation or a lead. The logs are evidence about access; the answer is evidence about inclusion.

I keep three stages separate:
- Verified crawling: the assistant’s bot fetched the page.
- Live-answer retrieval: the page was fetched in connection with a specific prompt.
- Answer inclusion: the brand or link appeared in the resulting answer.
These are different events, not interchangeable counts. A large number at the first stage does not establish a large number at the third. This four-week test of fetches, prompts and gaps shows how I separate a real ChatGPT or Perplexity fetch from background bot noise.
The last gap matters. A page can be fetched for a live answer and still lose the citation to a review site. It can also appear in a footnote rather than in the recommendation itself.
I treat retrieval as evidence that the page entered the process, not evidence that it persuaded anyone. For the visibility question, I return to repeated appearances in answers to the same purchase-intent prompts, counted under the same rules. Everything before that is plumbing.
Compare the specification, then decide who does the work
At this point, the buying test is straightforward. I send every shortlisted provider the same ten prompts and ask for the same five-part specification:
- Exact prompt text, with branded and unbranded results separated.
- Engines and market tested, including the question format used.
- Repeats per prompt, with the method used to combine results.
- Definitions of a hit, separating mentions, citations and recommendations.
- Run dates, with the observed variation across repeats.
A provider unwilling to supply that information has made comparison impossible. A glossy percentage does not repair the omission.
Judge the spec sheet before the score. Only after the specifications match can I compare what the providers actually observed.
Then comes the operational question: who acts on the findings? Monitoring software leaves someone on the team responsible for rewriting category pages, tightening product feeds and earning third-party proof. The report becomes useful when it points to work that ships, not when it generates another meeting about visibility.
When nobody owns that work, I favor managed delivery. That is the loop groas was built to absorb: measurement, investigation and page changes handled together instead of three vendors pointing at each other. The aim is not to manage a more flattering dashboard. It is to connect the findings to execution.
Read the two reports again
Now take the opening case: 78% and 35% for the same brand in the same week. I would not average them, choose the higher one or assume the lower one is more honest. I would reconstruct the tests.
Suppose the 78% report records 39 hits across 50 prompts. Thirty prompts name the brand, and any mention anywhere counts. The 35% report records seven hits across 20 unbranded purchase prompts, counting only top-three recommendations with a link to the brand’s own site.
First, the prompt panels differ. One leans heavily on recognition; the other tests selection without a branded hint. Next, the scoring rules differ. A passing mention qualifies in one report but not the other. Before treating either result as a trend, I would still need the engines, market, repeat counts and dates.
The lower number is more useful for this buyer-discovery question because of what it measures, not because it is lower. It describes a harder, more relevant test for a buyer still choosing a desk.
That is where I would start: freeze that purchase-intent panel, repeat it under the same rules, and let the next report show whether ApexDesk appears more often. The percentage comes last.


