How to Automate Brand Visibility Reports Across AI Assistants
October 5, 2026
•
6
min read


A founder drops a ChatGPT answer into Slack with his brand listed first. Everyone celebrates. Nobody asks what happens when a buyer asks the same question again tomorrow. I used to tell clients to take those wins at face value. I was wrong.
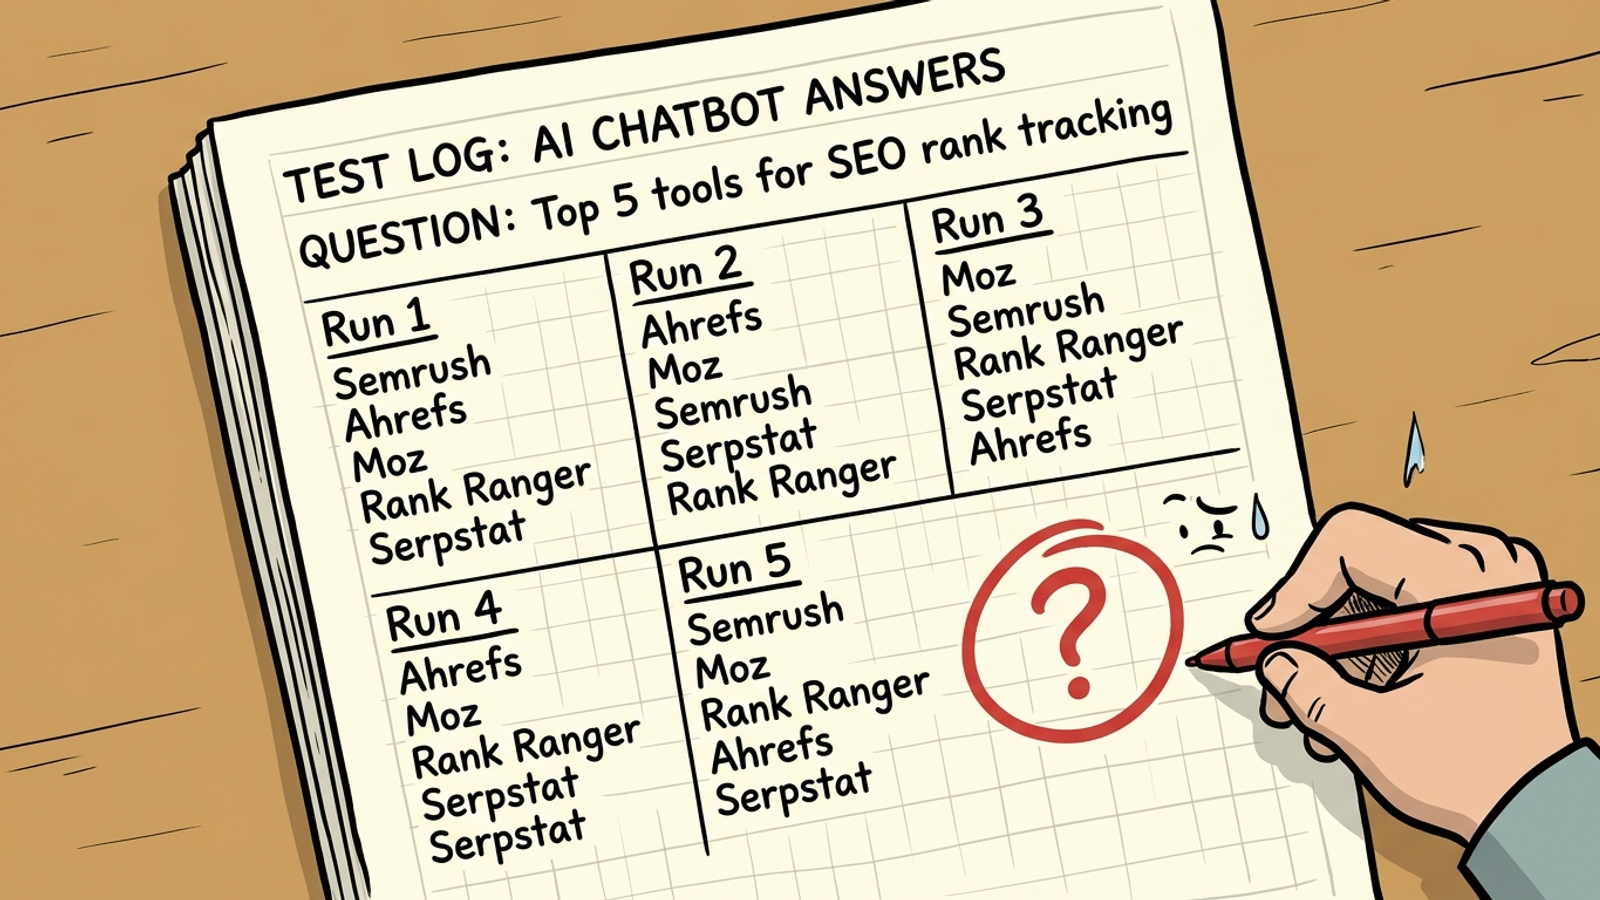
AI answers are nondeterministic: the same prompt can produce a different shortlist on another run. SparkToro ran the same brand prompts 2,961 times across ChatGPT and Google AI and got the same brand list in the same order only about 1 in 1,000 times. You are sampling from a distribution, not reading a fixed ranking. One screenshot cannot tell you whether visibility improved. For that, you need a fixed panel of buyer prompts, repeated runs per engine, and share of answer tracked against named competitors. Here is how I would set it up without turning the measurement itself into a full-time job.
Ask the same buyer question repeatedly and the shortlist can change even when your content has not. Models generate answers rather than return a fixed list of ranked pages, so mentions and citations can shuffle between runs. AirOps found only 30% of brands stay visible in consecutive AI answers and just 1 in 5 sustain visibility across five runs. I learned not to judge a Search campaign on a Monday for the same reason: a small sample can make ordinary variance look like a breakthrough.
Skip any tool or freelancer selling you a single pass over 10 prompts as a definitive visibility score. It may give you a useful snapshot, but a snapshot cannot show whether a change lasts. The refresh button is not a growth strategy.
Track visibility as a rate over repeated runs. Keep the screenshot for morale if you like. Build the panel before you spend money trying to reproduce it.
Start with questions buyers already ask, not questions you wish they asked. I would pull 20 to 30 prompts to start: five from sales call transcripts, five from support tickets, five from Search Console queries with clear intent, and five from comparison threads on Reddit or YouTube where your category gets argued about. AirOps recommends a 20-to-30-question baseline that includes branded and competitor-comparison queries, and suggests sourcing questions from support tickets, sales calls, Search Console data and social discussions.
The source matters. A prompt that nobody uses while buying can produce a lovely score that never gets near revenue. Before a question enters the panel, I want to know what buyer situation it represents. That does not require a research project. It does require resisting the temptation to fill the sheet with variations of ‘What is the best brand in this category?’
Split the list by intent. These four buckets make the misses easier to diagnose later:
Keep the wording fixed once measurement starts. If you rewrite a prompt between checks, you have changed the question and the answer at the same time. You can add new prompts later; just do not quietly splice them into the old panel and call the resulting score a trend. Write the buyer questions down before you look at the answers.
Count three things per run at first: mentions, citations and competitive presence. Mention rate is responses naming your brand divided by relevant responses; citation rate is responses citing your URL divided by total responses; and citation share of voice compares your citations with competitor citations. Keep the denominators and the competitor set visible in your sheet. A percentage without those details is a polished way to lose the plot.
The split matters because evidence and endorsement are different jobs. A model can use your page for facts while recommending a competitor. A high citation rate with a low mention rate means your content is doing work your brand is not getting credit for. Brands are 3x more likely to be cited alone than to earn both a citation and a mention in the same response, and only 28% of LLM responses included brands both mentioned and cited.
Choose three to five named competitors, then record who was mentioned, who was cited and who was recommended first in every run. I would give each run its own row rather than paste answers into a folder and promise to read them later. The sheet is less glamorous. It is also searchable.
Presence alone still misleads. A first recommendation and fourth place on a shortlist have different value, so track positioning, factual accuracy on pricing and coverage, and hallucination rate monthly. A buyer arriving after an answer gave the wrong price is not the same outcome as a buyer arriving properly informed. Note those errors without letting a detailed accuracy audit prevent you from starting the basic count.
Mention rate tells you whether you appear. Citation rate tells you whether your pages get used. Position and accuracy tell you whether that appearance is helping. Do not roll those jobs into one mystery score.
Question: For each buyer prompt, how often does each engine mention us, cite us and recommend us first? If those rates move, is the change large and persistent enough to investigate?
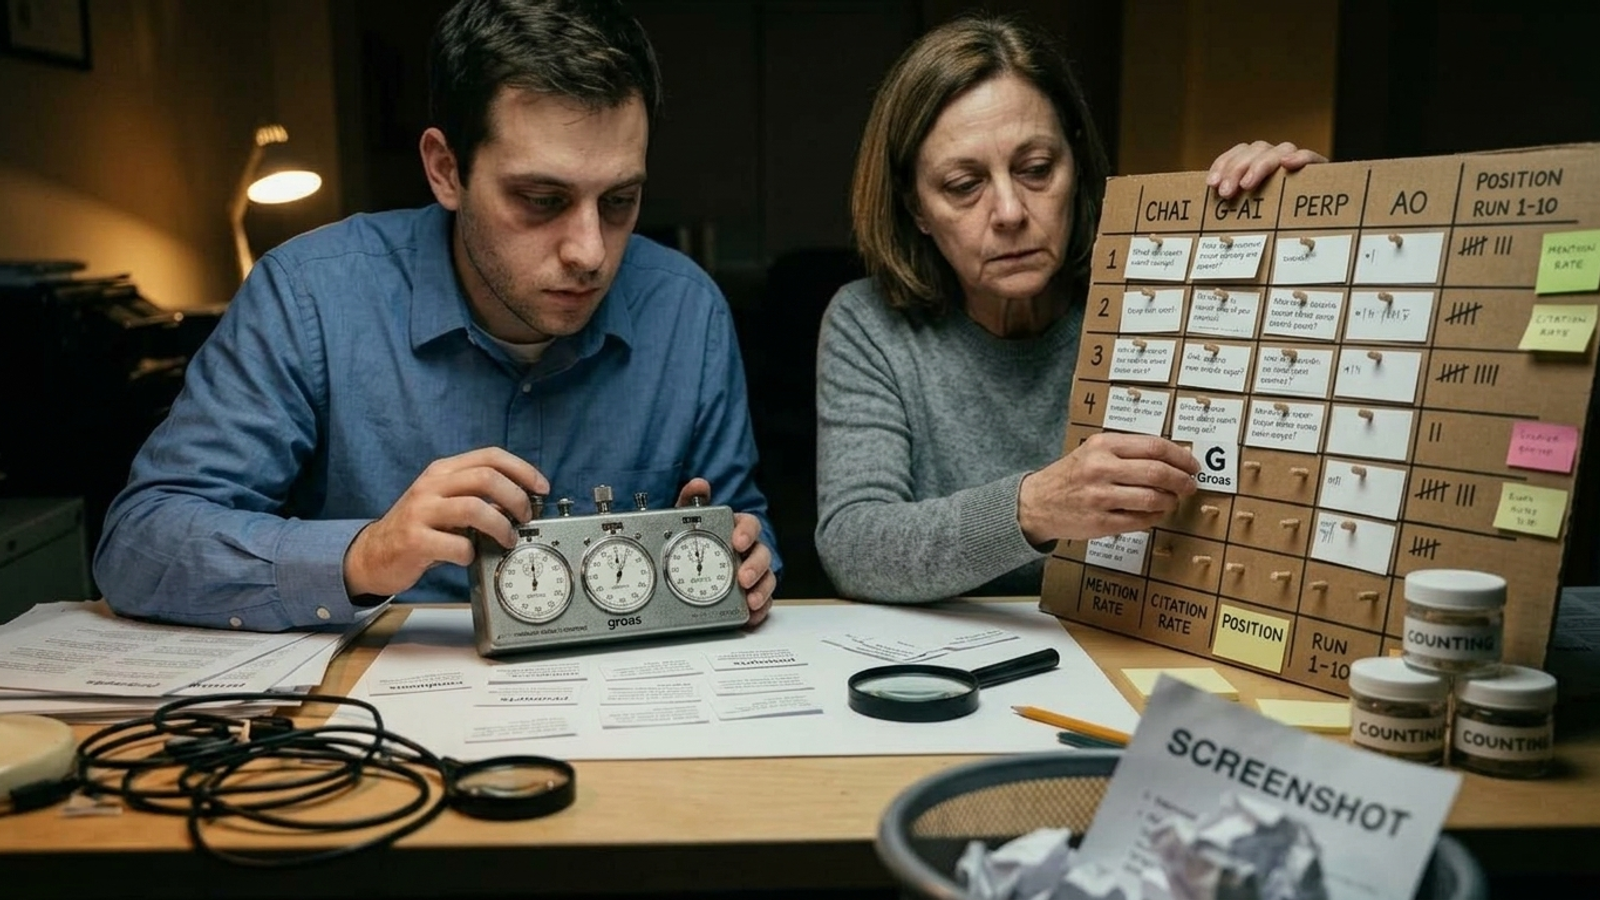
Setup: Choose 20 prompts from Step 1. Run each prompt 10 times per engine in a fresh, logged-out session, with location fixed to your main market. Keep the model version consistent during the round and log the date. Ten runs is a workable starting point, not a certificate of certainty. At 95% confidence, 5 runs leaves about plus or minus 43.8 percentage points of error; 30 runs tightens that to plus or minus 17.9; 100 runs to plus or minus 9.8; and 384 runs to plus or minus 5.0. The mechanism is sampling error: fewer runs leave more room for chance to dress up as a result.
Those figures are a warning against overreading a handful of answers, not a promise that every score in your sheet has the same margin of error. I expect many small teams to manage five to 10 runs per prompt. The larger-scale guidance cited for ZipTie calls for 100 to 300 prompts across four models, with five to 10 runs per prompt. You do not need that volume to begin. You do need to be honest about what your smaller panel can establish.
Controls:
Record per run: whether you were mentioned; whether you were cited and which URL was used; whether you appeared first, on a shortlist or in a footnote; and which named competitors appeared. Report rates by platform and date. Fixed prompts, repeated runs and per-platform reporting make the comparison usable; blending different tool methods into one chart makes it easy to fool yourself.
What I expect: Some apparent wins will disappear on the next set of runs because the first set caught a favorable answer mix. That does not mean the work failed. It means the first read was too thin to judge it. On 10 runs, a move of one or two answers is a reason to repeat the test, not announce a trend. If a change keeps appearing, expand the sample before treating it as the result of a fix. If it vanishes, leave the victory slide in drafts and investigate the next gap. The test should change what you do, not just what you report.
ChatGPT and Perplexity can produce similar-looking answers while drawing on information differently. Perplexity includes clickable citations in its responses, while ChatGPT cites less consistently and may need its browser tool to fetch the live web; answers often cite only 2 to 7 domains. Retrieval changes the opportunity. A fresh help document might surface quickly in one engine and leave another flat. Averaging those results would hide the only useful clue about where to work next.
Gemini and AI Overviews also make Google visibility relevant to the diagnosis. AI Overviews appear in about 15.69% of queries overall but in 74% of problem-solving queries. That makes your problem-prompt bucket worth watching separately. If you have useful problem content that Google can find, it has a path into an Overview; if the page cannot be found or used, polishing the prompt tracker will not fix it.
Search Console offers another check, with limits. Its Generative AI reporting shows impressions for AI Overviews and AI Mode by page, country, device and date, but not queries, clicks or positions. An impression can support a visibility read. It cannot, on its own, tell you what a buyer asked or what revenue followed.
Keep each engine’s trend separate. When one moves and another does not, that difference is part of the diagnosis, not an inconvenience to average away.
Sort losing prompts into three piles. Each calls for different work:
I would tag each losing prompt with one of those labels before changing anything. Otherwise, it is too easy to prescribe another blog post for every problem. Fixing an authority gap with another blog post is how teams burn two months and move nothing.
The order I would work through the piles is boring and deliberate. Check technical access first: a page that cannot be retrieved has no chance to supply an answer. Then address content gaps, starting with high-value losing prompts. Make the relevant page quotable with a direct answer up top, useful numbers, named limits, dates and sources where the page needs them. Work on authority gaps after that, because earning references from pages the models already favor takes longer than editing your own.
Do not mistake this order for a rule to rebuild the entire site before checking a single result. Pick a losing prompt, write down why you think you lost it in one sentence, make the corresponding change and rerun the panel. If competitors are cited and you are not, diagnose the miss before you write a new paragraph.
A tracker earns its fee by doing the runs you will not do by hand. It holds prompts fixed, reruns them on schedule and charts mention rates and citation share by engine with dates attached. Trackers measure. They do not fix. Software will not rewrite a thin service page, make hidden pricing retrievable or earn a reference from a publication the models already use. I use tools for cadence and proof, and budget separately for the work intended to move the numbers. Buy only the chart and you may end up with a very precise record of staying invisible.
That second part is where a done-for-you service either pays for itself or does not. I am partial to how we approach groas earned search, because the work maps to the three piles: content built to be quoted, technical gaps closed so pages can be retrieved, and citations earned with a strategist watching the rates. The for-businesses page puts the goal plainly: own the narrative so LLMs cite you when buyers ask.
My test for any vendor is the same. Ask which losing prompts they would fix first, what they would ship in week one and what size of swing they would treat as noise. If they cannot answer in those terms, keep the tracker and skip the retainer. A dashboard is not an explanation of the work behind it.
I would use a light cadence once the baseline exists: daily checks on five money prompts, a weekly rerun of the full 20-prompt panel per engine, and a monthly read of share of answer against competitors. That resembles a rhythm practitioners can sustain: daily scans for critical topics, weekly brand audits and monthly competitive analysis. The daily check catches something worth examining; the repeated panel gives you a better basis for judgment. A spike once is weather, not proof.
First thing today: freeze 20 buyer prompts in a sheet. Run each one five times, logged out, in ChatGPT and Perplexity. Record the date and your mention rate for each engine. That sheet is your baseline. Every future fix has to earn its place against more than one screenshot.
How many AI answer screenshots do I need to know if my visibility actually improved?
A single screenshot cannot tell you, because AI answers are nondeterministic and the same prompt can produce a different shortlist on another run. Track visibility as a rate over repeated runs on a fixed panel of buyer prompts, compared against named competitors, instead of judging from one answer.
How do I tell if a change in AI answers is real improvement or just random variation?
Run each prompt multiple times per engine in fresh, logged-out sessions with location fixed, and check whether the rate move is large and persistent. With 10 runs, a move of one or two answers is a reason to repeat the test, not announce a trend; only a change that keeps appearing across expanded samples deserves action.
Can I combine results from ChatGPT and Perplexity into one visibility score?
No. Perplexity includes clickable citations while ChatGPT cites less consistently and may need its browser tool, so the same content can perform differently in each engine. Report rates by platform and date, because when one engine moves and another does not, that difference is part of the diagnosis.
My competitors keep getting cited instead of me. What should I fix first?
Sort losing prompts into content gaps, technical gaps and authority gaps, then check technical access first, since a page that cannot be retrieved has no chance to supply an answer. Next address content gaps on high-value prompts, and work on authority gaps last, because earning references from pages the models already favor takes longer.
How often should I check my AI visibility once I have a baseline?
Use a light cadence: daily checks on five money prompts, a weekly rerun of the full 20-prompt panel per engine, and a monthly read of share of answer against competitors. A spike once is weather, not proof, so the repeated panel is what gives you a sound basis for judgment.
Will buying an AI visibility tracker fix my visibility problems?
No. A tracker holds prompts fixed, reruns them on schedule and charts mention and citation rates, but it will not rewrite a thin page, make hidden pricing retrievable or earn references. Budget separately for that work, and ask any vendor which losing prompts they would fix first and what they would ship in week one.