

 LinkedIn

A 25% rise in Meta ROAS can sit beside a 25% increase in new-customer cost. That is illustrative arithmetic, not a campaign result, but it exposes the problem with calling a better dashboard an acquisition recovery.
Attributed revenue counts orders the platform can claim inside its attribution window, including orders from returning customers. New-customer cost counts only first-time buyers. Shift the mix toward past buyers, and the revenue ratio can improve while acquiring someone new gets more expensive.
Both numbers can be right. The recovery story can still be wrong.
I want those two jobs separated before an agency gets credit: acquiring customers and selling again to customers the business already has. Profitable retention deserves a budget. It does not deserve to borrow acquisition’s name.
The denominator tells you which job improved
The distinction starts with two fractions. One CAC-versus-ROAS breakdown defines customer acquisition cost as total marketing and sales spend divided by new customers, while ROAS divides attributed revenue by ad spend and includes returning customers.
Free tool: the ROAS Calculator works out your return on ad spend, your break-even ROAS and the budget a revenue goal takes.
That also creates a terminology problem. If the calculation includes only ad spend, I call it new-customer media cost, not fully loaded CAC. Otherwise, a report can quietly compare the cost of media with the cost of the entire acquisition operation. Those are not interchangeable.
Here are the three columns I want beside each other:
| Metric | Numerator | Denominator | What it does not establish |
|---|---|---|---|
| Overall attributed ROAS | Attributed revenue from new and returning buyers | Ad spend | Whether acquisition improved |
| New-customer ROAS, or ncROAS | Attributed first-order revenue | Ad spend | Whether the ads caused those orders |
| New-customer media cost | Ad spend | Store-matched new customers | Whether those customers are profitable |
Separate first-order revenue from returning-customer revenue before interpreting the overall ratio. Otherwise, repeat purchases can make the account look more efficient without making new-customer acquisition cheaper.
The same breakdown gives a useful example: Rs 80,000 in retargeting spend produced Rs 544,000 in revenue, or 6.8x ROAS, while 79% of buyers were repeat buyers. It reports just 23 new customers and Rs 3,478 in new-customer CAC.
Those are figures from that source’s example, not a benchmark for your account. Their value is the contrast: the headline ratio describes all attributed revenue; the acquisition calculation describes a much smaller group.
I used to present numbers like that as an uncomplicated win. I was wrong to stop there. I had not asked whose revenue it was.
Worked example: ROAS improves while acquisition gets more expensive
Every input below is illustrative arithmetic, not observed campaign performance. I hold spend flat so the split is visible without a budget change muddying the comparison.
| Period | Ad spend | Attributed revenue | Overall ROAS | New customers | New-customer media cost |
|---|---|---|---|---|---|
| Before | $1,000 | $4,000 | 4.0 | 50 | $20.00 |
| After | $1,000 | $5,000 | 5.0 | 40 | $25.00 |
The calculations are straightforward:
- ROAS: $4,000 ÷ $1,000 becomes $5,000 ÷ $1,000. That is a 25% increase.
- New-customer media cost: $1,000 ÷ 50 becomes $1,000 ÷ 40. That is also a 25% increase.
One possible mechanism is a shift toward past buyers: more attributed revenue comes from people who need less persuasion, while fewer first-time buyers enter the store. The overall report improves even as the account brings in fewer new customers for the same spend.
The table does not establish that mechanism. It contains no audience allocation or revenue split. It establishes the narrower point that matters here: a higher ROAS does not mathematically require better acquisition efficiency.
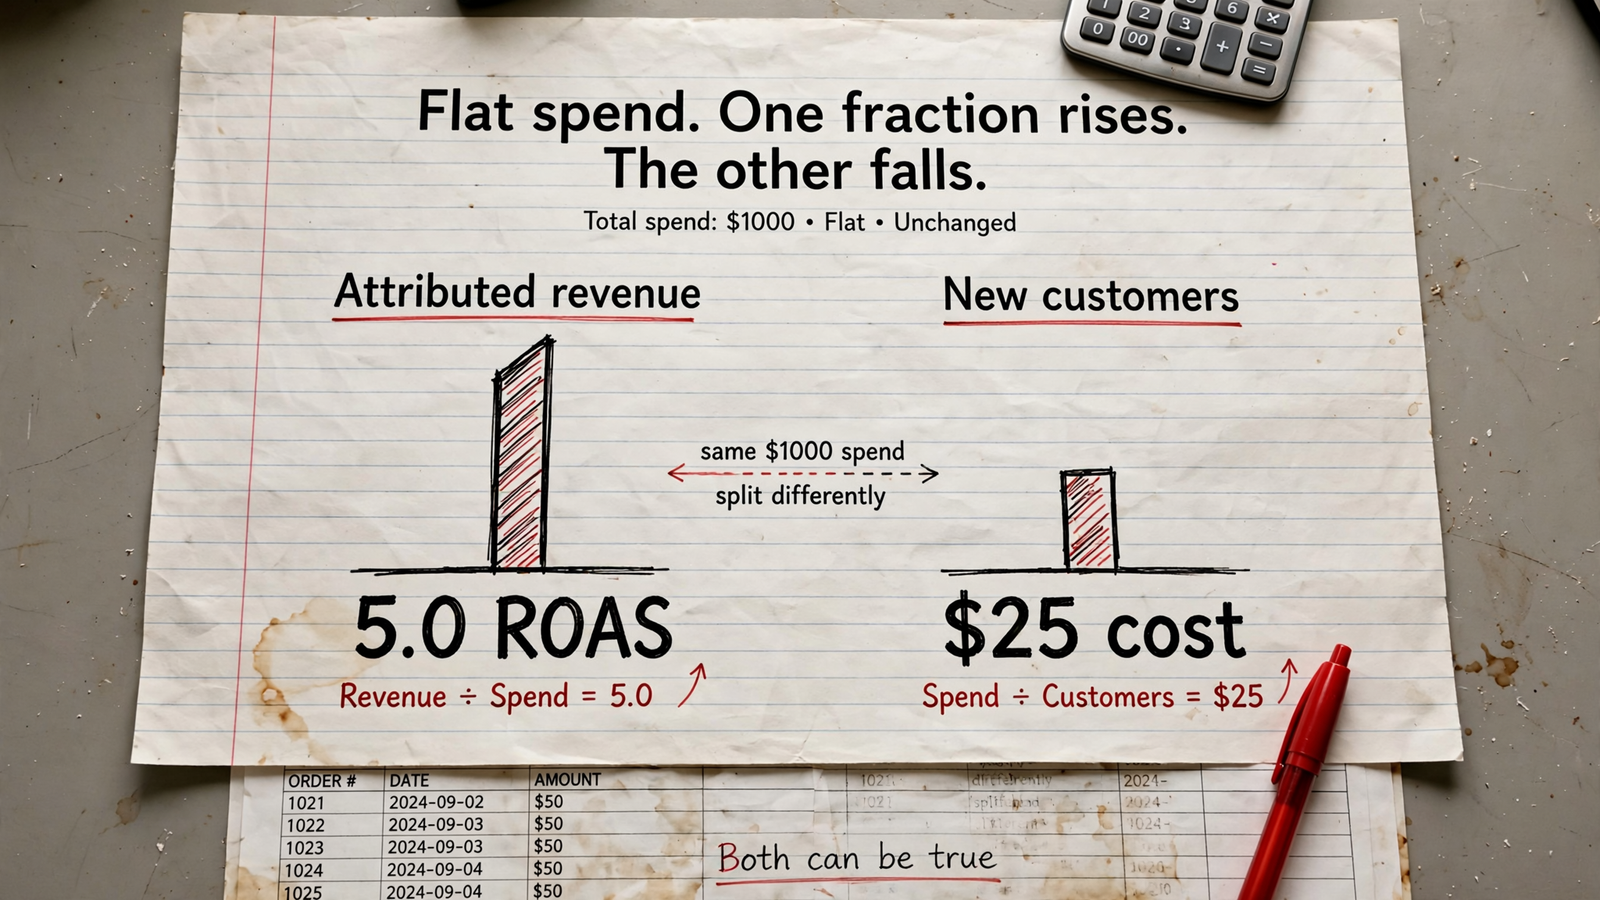
Spend does not need to rise for this split to happen. A change in the mix of buyers can be enough. But in a real account, I would ask for the new-versus-returning revenue breakdown before blaming that mix. The arithmetic tells me what is possible, not what caused your result.
There is another limit worth keeping visible: the table cannot calculate ncROAS because it does not include first-order revenue. A new-customer count is not a revenue figure. Filling that gap with an assumption would turn a useful illustration into a confident-looking fiction.
My practical takeaway is simple: when overall ROAS climbs, check both the number of new customers and the revenue they brought in. Do not make either one stand in for the other.
A platform audience label is not a store customer record
The audience split deserves scrutiny because the platform and the store do not necessarily use the same dictionary.
An AdBeacon explanation of Meta’s New Audience definition describes it as people who do not match the advertiser-defined existing-customer and engaged audiences. That is an audience classification. It is not the same thing as a first-time order in Shopify or your CRM.
“New” in an audience report is not enough to establish “new customer” in the business. I want the buyer matched to the store’s order history, with refunds and cancellations handled consistently.
This is why I would not accept an audience screenshot as the answer to an acquisition question. I would ask:
- Which customer lists define existing buyers?
- Which audiences are excluded, and where?
- Where do spending limits apply?
- How does the agency check first-order share against store records?
Those questions test the actual setup rather than the campaign’s label. They also keep the discussion on the mechanism: who receives the ads, who buys, and which of those buyers is genuinely new.
If the agency reports overall ROAS without a store-matched new-customer column, I cannot tell whether it improved acquisition or simply found more revenue among existing buyers. That is a reporting gap, not a reason to invent an answer.
Reconcile attribution before crediting the recovery
Even a clean new-versus-returning split leaves another question unanswered: did the ads create the sale?
Attribution assigns credit; it does not, by itself, establish incrementality. A first-time buyer can still have purchased without the click. A returning buyer can still have needed the ad. Neither customer status settles the counterfactual.
Start with the attribution window and conversion lag. A click early in the week can receive credit for a purchase days later, after reviews, word of mouth, or other marketing touches. That does not make the attribution invalid. It means the reported revenue answers a narrower question than “how much demand did this campaign create?”
I want the window stated beside the result, not buried in a settings menu. I also want the comparison periods to allow for the same lag. Otherwise, the report may compare one period’s more complete conversions with another period’s unfinished ones.

Then stop adding platform revenue totals together. As this cross-platform attribution explanation describes, Meta and Google can each claim the same order inside their respective windows. Adding those claims does not produce additional store revenue.
The useful reconciliation is a sequence, not a collection of screenshots:
- Use comparable dates and attribution settings. State what changed if the settings differ.
- Allow for conversion lag. Do not declare a recovery from mismatched reporting maturity.
- Split first orders from repeat orders. Apply refunds and cancellations consistently.
- Compare platform claims with store orders. Do not sum overlapping claims as though they were separate sales.
- Keep the causal limit visible. Reconciled reporting still does not prove incremental lift.
That last point matters. Better bookkeeping makes the performance claim easier to inspect. It does not turn the claim into an experiment.
Higher acquisition cost is not automatically failure
The outside data shows why the acquisition column deserves attention. An independent attribution analysis covering 55,661 Meta campaigns reports Advantage+ new-customer cost rising from $257 in May 2024 to $528 in May 2025, roughly a 105% increase.
That is one vendor’s dataset, with its own methods and limits. It is not evidence that your account followed the same path, and it does not establish what happened to your ROAS. I use it as a reason to ask for the acquisition calculation, not as a substitute for doing it.
Even when new-customer cost rises, the business has not necessarily made a bad trade. Cost needs a margin and customer-value context. A cheaper first purchase is not automatically a better customer.
In an illustrative comparison, a $25 customer who reorders twice at 70% margin can be worth more than a $20 one-and-done buyer. But those labels alone do not settle the economics: order value and the relevant costs still belong in the sheet. The point is to examine the cohort, not worship the lowest acquisition number.
Retention can also be the agreed job. Selling profitably to past buyers may be exactly what the business wants from part of its budget. The error is not doing that work. The error is presenting the resulting ROAS lift as proof that acquisition recovered.
I would separate the decisions:
| Decision | Evidence I want |
|---|---|
| Is acquisition becoming more efficient? | Store-matched new-customer cost and first-order revenue on comparable dates |
| Is the acquisition cost acceptable? | Contribution margin and repeat-purchase economics for the cohort |
| Is retention earning its budget? | Returning-customer revenue and the margin behind it |
| Did advertising cause the improvement? | Evidence beyond attributed reporting alone |
Keep profitable retention. Just make it earn its budget under its own name.
What a credible management report must disclose
A credible report puts acquisition and retention on the same page, in separate columns. I should not need a second meeting to find out which customers produced the headline ROAS.
At minimum, I want:
- Ad spend and overall attributed ROAS.
- Attributed first-order revenue and ncROAS.
- Store-matched first-time orders, with refund handling disclosed.
- New-customer media cost.
- Returning-customer revenue, shown separately.
- Contribution margin and repeat-purchase context where those support the budget decision.
Every row needs the same date logic. Every claimed improvement needs a comparison period. This is the same reporting problem I examine in Your Meta ROAS Can Rise Without a Single Extra Sale: platform revenue can climb while store demand does not, so the report has to show what actually changed.
Then put the work beside the outcome. List the creative shipped, audiences excluded, spending limits set, and tracking fixes made. State what the measurement cannot prove.
A report that shows 5.0 ROAS without first-order share, refund handling, or lag is a screenshot, not an acquisition argument. If I cannot see the action log next to the numbers, I am being asked to pay for the story.
That is the operating standard groas brings to search: continuous execution, actions logged with reasoning, and a named strategist accountable for direction and results. It makes the work inspectable. It does not make attributed reporting proof of incremental lift, and no honest provider should pretend otherwise.
Make the renewal decision from the store, not the trophy
If I am evaluating a Meta agency on a recovery promise, I want the sales call to do this math live. Which ROAS will it optimize toward: overall or new-customer? How will it match reported buyers to Shopify or CRM first orders? What will it show when the two ratios move apart?
The answer should be a calculation and an explanation of the work, not another dashboard screenshot. Creative testing volume may describe activity. It does not answer whose purchases produced the revenue.
That is also the filter I would apply to a best-company-for-ecommerce list. A case-study ratio tells me little about acquisition until I can see which buyers produced it and what the business paid to acquire them.
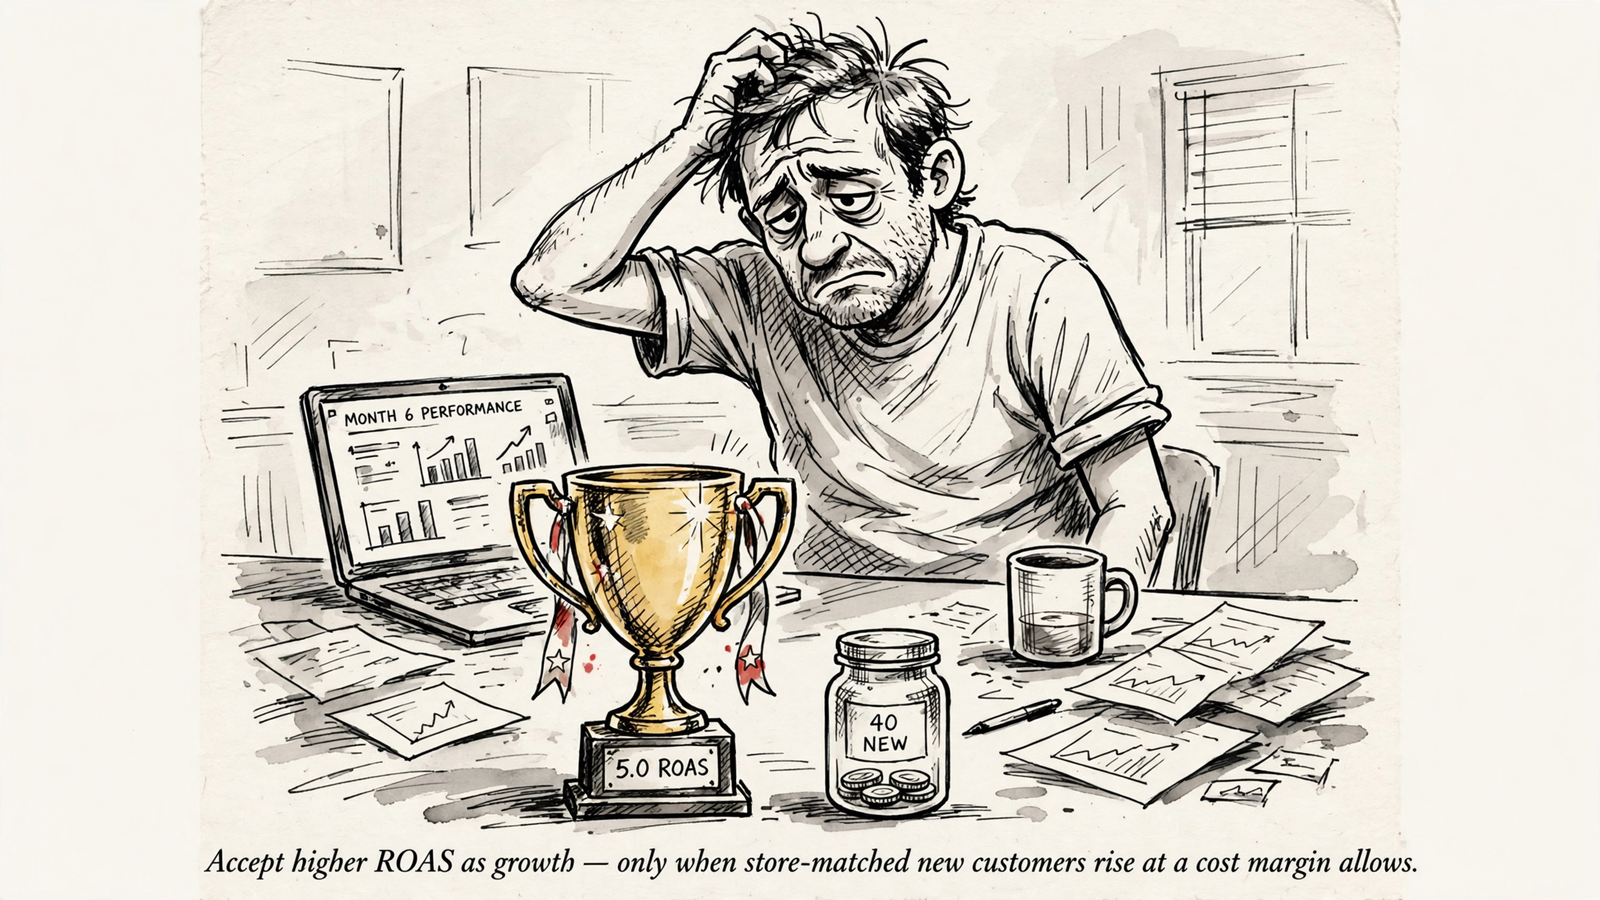
Run the check before renewing or switching. Use comparable windows, allow for lag, split first orders from repeats, and reconcile platform claims with store revenue. Put contribution margin beside both customer groups.
In my illustrative table, ROAS rises from 4.0 to 5.0 while new customers fall from 50 to 40 on the same $1,000 spend. That does not mean the business became 25% better at growth. It means attributed revenue per ad dollar improved while media cost per new customer rose 25%.
The vendor dataset is not your store. Neither is my arithmetic. Pull your own overall ROAS, ncROAS, and store-matched new-customer cost for the last 60 days, using equal dates and consistent refund handling.
Keep retention when its economics justify it. Accept an acquisition recovery only when the new-customer numbers support it at a cost your margin allows. Make the next budget decision from that sheet, not from the tallest ROAS trophy.


