

 LinkedIn

An ecommerce Meta agency can show you a beautiful ROAS screenshot while your store keeps very little of the money. When I compare agency pitches, I want to know what counted as revenue, who actually bought, and what remained after refunds, discounts, and shipping. The biggest platform number is not necessarily the best business result. These five myths make it far too easy to hire the wrong agency.
Myth 1: “The agency with the highest reported ROAS is the best hire”
ROAS looks like a clean scoreboard. One agency shows 3.1x, the other shows 2.3x. Pick the bigger number and get back to running the store. I understand the appeal: a hiring decision reduced to one decimal place.
Free tool: the ROAS Calculator works out your return on ad spend, your break-even ROAS and the budget a revenue goal takes.
But the attribution setting decides which purchases count. Change that setting and the same spend can report a different ROAS without another dollar entering the store till. One worked example on $5,000 in spend moves from 1.71x on 1-day click to 2.30x on 7-day click to 3.06x on 7-day click plus 1-day view. Those are different ways of assigning credit, not three different campaign results.
That does not make the broader window fraudulent or the narrower window automatically correct. It makes the screenshots incomparable until someone explains the settings. A purchase days after a click and a purchase after an ad view are not the same evidence, even when both appear under the same revenue total.
Before touching a campaign, ask each finalist to put its case study on the same basis:
- Revenue definition: What money goes into the numerator?
- Purchase event: What action counts as a purchase?
- Attribution setting: Which clicks and views qualify, and for how long?
- Reporting period: Which dates does the result cover?
The Compare attribution settings view helps separate the view-through share from purchases credited after a longer click delay. That shows how much of the headline depends on people who saw an ad without clicking, or bought days after clicking.
I would also ask the agency to explain why its platform total differs from the store’s total. Meta can credit a purchase after a qualifying click or view, while Shopify’s default credits the last non-direct channel. Meta may claim a sale Shopify assigns to search or email. Add another ad platform and the same order can appear in more than one report. The store still receives one order.
If an agency will not put its best case study on your attribution basis, do not use that case study to choose it.
Myth 2: “A purchase is a purchase, even if it gets refunded”
Meta fires the Purchase event at checkout. Shopify shows the order a second later. Clean match. It is tempting to reconcile those two numbers and call the job finished.
The problem is that the store does not keep every purchase. Online sales had a 19.3% return rate in 2025, with online apparel returns sitting around 30%. The exact rate for your store matters more than either benchmark, but the mechanism is the same: a checkout event can survive in campaign reporting after the money leaves your bank account.
Meta keeps the original revenue on the dashboard. Your bank does not.
Ask each finalist how it reconciles campaign reporting with store records. I want cancellations and partial refunds deducted from the revenue it claims, and exchanges reconciled rather than treated as untouched sales. I also want to know when that reconciliation happens. A report that never revisits checkout revenue never learns what the store actually kept.
The first 30 days are a useful place to inspect the mismatch. Ask the agency to walk through that period rather than answer with “we optimize to platform revenue.” That sentence tells you what its dashboard owns. It does not tell you who owns retained revenue.
The mechanics are laid out in Your Meta ROAS Counts the Sale. Does It Count the Refund?. The hiring question is simpler: can the finalist show the difference between revenue recorded and revenue retained?
Judge agencies on refund-adjusted revenue, not checkout events with a currency symbol attached.
Myth 3: “A profitable repeat buyer proves profitable customer acquisition”
Blended ROAS is easy to like because it puts the whole account into one tidy number. Repeat buyers and site visitors convert cheaply, lifting the average while new-customer prospecting can quietly lose money. The report says the account works. It does not say which part works, or whether that part can bring in more customers.
That is the distinction I care about when an agency proposes more budget. Selling again to someone who already knows the store can be worthwhile. It is not proof that the agency can acquire a stranger profitably. Calling both activities growth does not make them interchangeable.
Meta offers an Audience Segments breakdown for Sales campaigns: New Audience, Engaged Audience, and Existing Customers. Useful, but not a ready-made customer ledger. The segments depend on custom audiences you define, and the breakdown applies only to impressions after those definitions are saved.
There is another catch: the Engaged definition excludes Page, Instagram, and video-view audiences, so some people with prior engagement can land in New. A label is not proof that the person has never encountered the business.
Ask every finalist for the mix behind its headline:
- What share of reported revenue came from new, engaged, and existing customers?
- How did it define each group?
- When did those definitions take effect?
- Can it separate new-customer results from the blended account result?
If the agency cannot answer, its high ROAS does not establish that prospecting works. It may simply show that past buyers still like the store. Nice to know. Not enough to fund a scaling plan.
I spell out the hiring choice in I’d Hire the Meta Agency With Lower ROAS—If It Could Prove New-Customer Growth: the lower blended number with clean new-customer evidence usually beats the higher number built on past buyers.
Make new-customer revenue a separate line item, or stop calling the blended result customer acquisition.
Myth 4: “More sales at the same ROAS means the store can afford to scale”
This sounds reasonable because the ratio stays steady. If the agency can buy more revenue at the same apparent efficiency, why stop it?
Because ROAS measures revenue against ad cost, not profit. The margin behind that revenue decides whether the store can afford the advertising. Change the products, discounts, or fulfilment costs and the same 3.0x can move from a win to a loss without the dashboard changing color.
Break-even ROAS depends on contribution margin: what remains after product cost, fulfilment, shipping, fees, and returns, before ad spend. A worked example makes the distinction concrete. With 10,000 in ad spend, 4.0x ROAS at a 22% margin loses money, while 2.5x at a 48% margin clears a profit. The lower screenshot wins because there is more money left to pay for the ads.
Discounts make this especially easy to miss. In the same calculator’s example, moving from full price to 20% off pushes net break-even ROAS from 2.6x to 4.2x. At 30% off, it reaches 7.4x; at 40% off, that example has no break-even point. Those are the economics of that example, not universal discount thresholds. The lesson is that the target has to move when the margin moves.
Add free shipping, a shift toward low-margin SKUs, and platform reporting that includes VAT and shipping, and the agency can hit its target while the store funds the difference. “We maintained ROAS” is not much comfort if maintaining it cost you money.
Before recommending more budget, the agency should ask for:
- Net margin by category.
- Refund and cancellation rates.
- Shipping cost per order.
- The discount plan behind the next campaign.
I would hand over those inputs and ask for break-even ROAS in writing. If the category mix changes or next month’s promotion takes 20% off, the break-even point changes. The budget recommendation has to change with it.
No margin inputs, no scale decision. An agency that asks for those inputs before talking about more spend is doing the work. One that skips them is guessing with your money.
Myth 5: “A flat fee or short guarantee makes the campaign low-risk”
This is the myth I find hardest to kill because it feels like prudence. A flat $2,500 a month sounds controlled next to 15% of spend. A 30-day guarantee sounds like the agency shares the downside. Both make the proposal easier to approve.
Neither caps the media loss.
Say you spend $20,000 a month. A 15% fee adds $3,000; a flat $2,500 saves $500. That is a real saving, but it still leaves $20,000 of media that can be spent badly. A predictable management invoice controls one cost. It does not control the much larger budget the agency manages.
I would judge those two things separately. The fee deserves scrutiny. So does the work it buys. But the cheaper invoice does not make weak targeting, loose budget decisions, or discount-heavy scaling any safer.
Guarantees need the same separation. Competitors, creative fatigue, and seasonality move, which is why guaranteed ROAS or CPA appears on agency red-flag lists. Read what the promise actually covers. A refunded management fee or an extra month of work is not the same as recovering the media budget spent on a failed test.
Separate service terms from performance evidence. I would assess each on its own:
- Fee: What work does it buy? Look for creative testing, tracking checks, budget decisions, and reporting you can audit.
- Guarantee: What gets refunded or repeated, under which conditions?
- Media controls: What are the daily caps and the rules for stopping losers?
- Authority: Who can pause spend without waiting for a meeting?
- Targets: Do decisions use refund-adjusted revenue and the store’s margins, or just platform ROAS?
Those questions bring the hiring decision back to the store rather than the proposal. Send every finalist the same requirements: the same revenue definition and attribution basis, refund-adjusted results, a defined new-versus-existing split, and margin inputs before any scaling recommendation.
The agency worth hiring may show you a smaller number than its screenshot and explain why it trusts that number more. The wrong one will defend the screenshot. I am not buying the platform total. I am buying the reasoning that connects ad spend to what the store keeps.
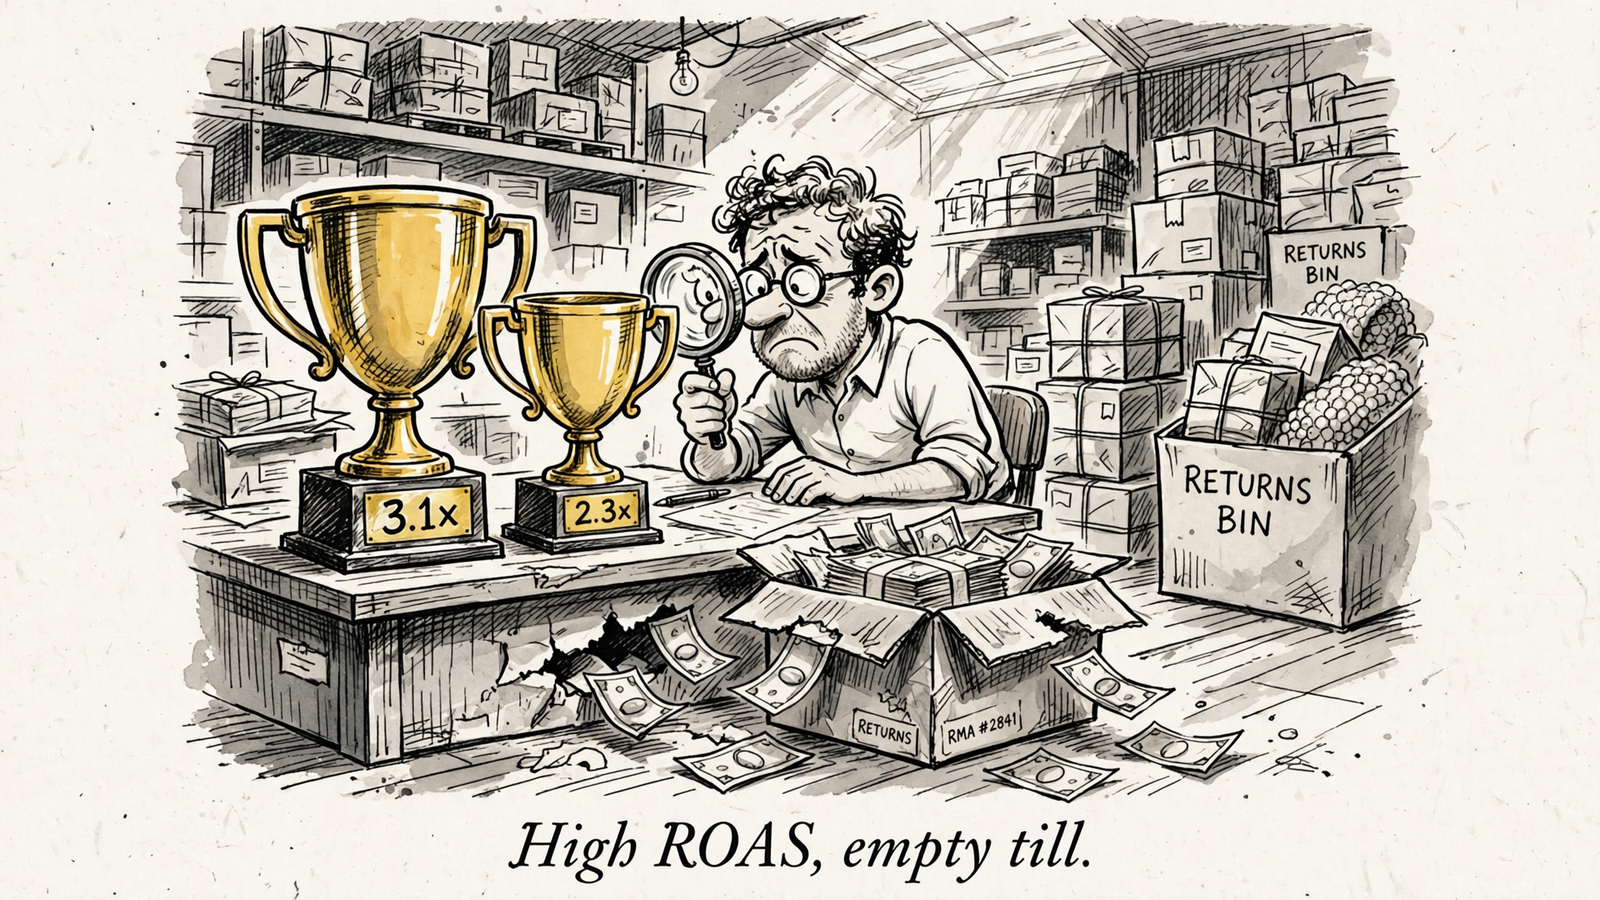
That comparison only works if you bring your half of the data. No agency can work out your scaling economics from Ads Manager alone. Give each finalist the margin, refund, shipping, and discount inputs, then see what it does with them. Does it revise its target? Explain the tradeoff? Ask a useful follow-up? Or return to the slide with the large green number?
This is also what I value in the operating model behind groas: continuous execution with a named human responsible for direction and accountability, rather than work waiting for a weekly review. Its emphasis on monitoring what matters and making the reasoning behind actions visible is the standard I want applied to an agency’s decisions. The case for that model is not simply a tidier invoice. It is less waiting, clearer ownership, and decisions that can be inspected. None of that excuses skipping the store economics.
No agency controls your margins, fulfilment, or returns. The good one asks about them before spending more. The weaker one treats them as someone else’s problem while presenting revenue as proof of profit.
A flat fee still feels safe because the invoice never surprises you. The media line is where stores can get hurt, quietly, $500 at a time, while the fee stays flat and the report stays green. Saving $500 on management does not protect the $20,000 being managed.
Ask for kill rules, daily caps, and refund-adjusted targets in writing. Hire the finalist that volunteers its smaller, store-kept number and can explain the decisions behind it. That is the only screenshot worth paying for.


