

 LinkedIn

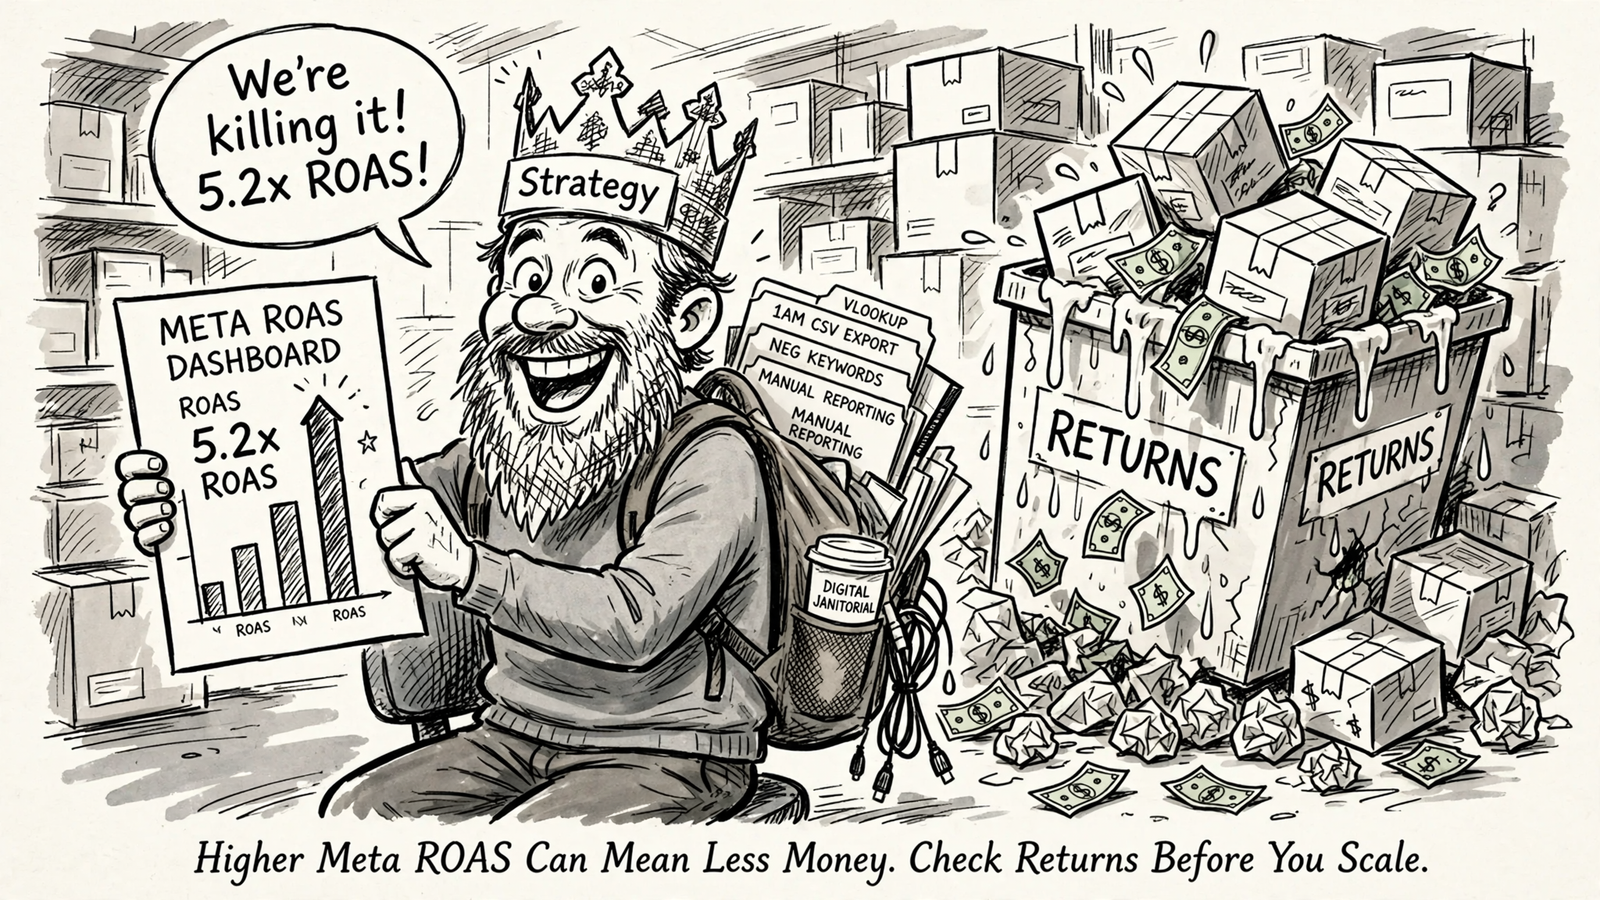
Higher Meta ROAS can mean you keep less money. The campaign your agency wants to scale can be the one your refund ledger would cut first.
The mechanism is simple. Meta records purchase value at checkout. Refunds, cancellations and product costs settle later, outside that purchase event. Unless your reporting accounts for those adjustments, the dashboard celebrates revenue the business does not keep.
In one worked example of refunds and reported ROAS, $100k in purchase value on $25k in spend produces 4.0 ROAS. Refund $15k and settled revenue falls to $85k. Settled ROAS is now 3.4. The dashboard still shows 4.0.
Free tool: the ROAS Calculator works out your return on ad spend, your break-even ROAS and the budget a revenue goal takes.
I used to tell clients to push the highest-ROAS ad set. I was wrong. Before asking an agency to scale the winner, check what the business keeps.
A purchase event is not a finished transaction
Meta reporting and your order ledger answer different questions:
- Meta: How much purchase value can I attribute to the ads people clicked or viewed?
- Your ledger: How much revenue survives refunds and cancellations, and what remains after product cost, shipping and fees?
Treating those answers as interchangeable is how bad scaling decisions get made.
ROAS divides revenue by ad spend. It does not deduct product cost, shipping, fees or refunds. A 3.0 can look strong and still lose money after those costs. Returns widen the gap because a refunded order can remain in reported ROAS: the purchase value was recorded before the refund happened.
Break-even math makes the problem harder to wave away. Break-even ROAS equals 1 divided by margin before ads. A $60 product with $26.96 in contribution before advertising needs roughly 2.23 ROAS just to cover ad spend. A 2.0 at that margin is a loss wearing a win costume.
And that calculation only helps if the revenue and margin reflect the orders you actually keep. A purchase event starts the accounting. It does not finish it.
The 4.0 campaign can lose to the 3.2 campaign
Take this as a hypothetical, not a client result. You spend $10k on each of two campaigns. Campaign A reports $40k in purchase value. Campaign B reports $32k.
Any screenshot ranking puts A first. Your ledger can reverse that ranking once refunds and margin clear.
| Measure | Campaign A | Campaign B |
|---|---|---|
| Ad spend | $10,000 | $10,000 |
| Reported purchase value | $40,000 | $32,000 |
| Reported ROAS | 4.0 | 3.2 |
| Refunds | $8,000 | $960 |
| Settled revenue | $32,000 | $31,040 |
| Margin before ads | 40% | 65% |
| Contribution before ad spend | $12,800 | $20,176 |
| Contribution after ad spend | $2,800 | $10,176 |
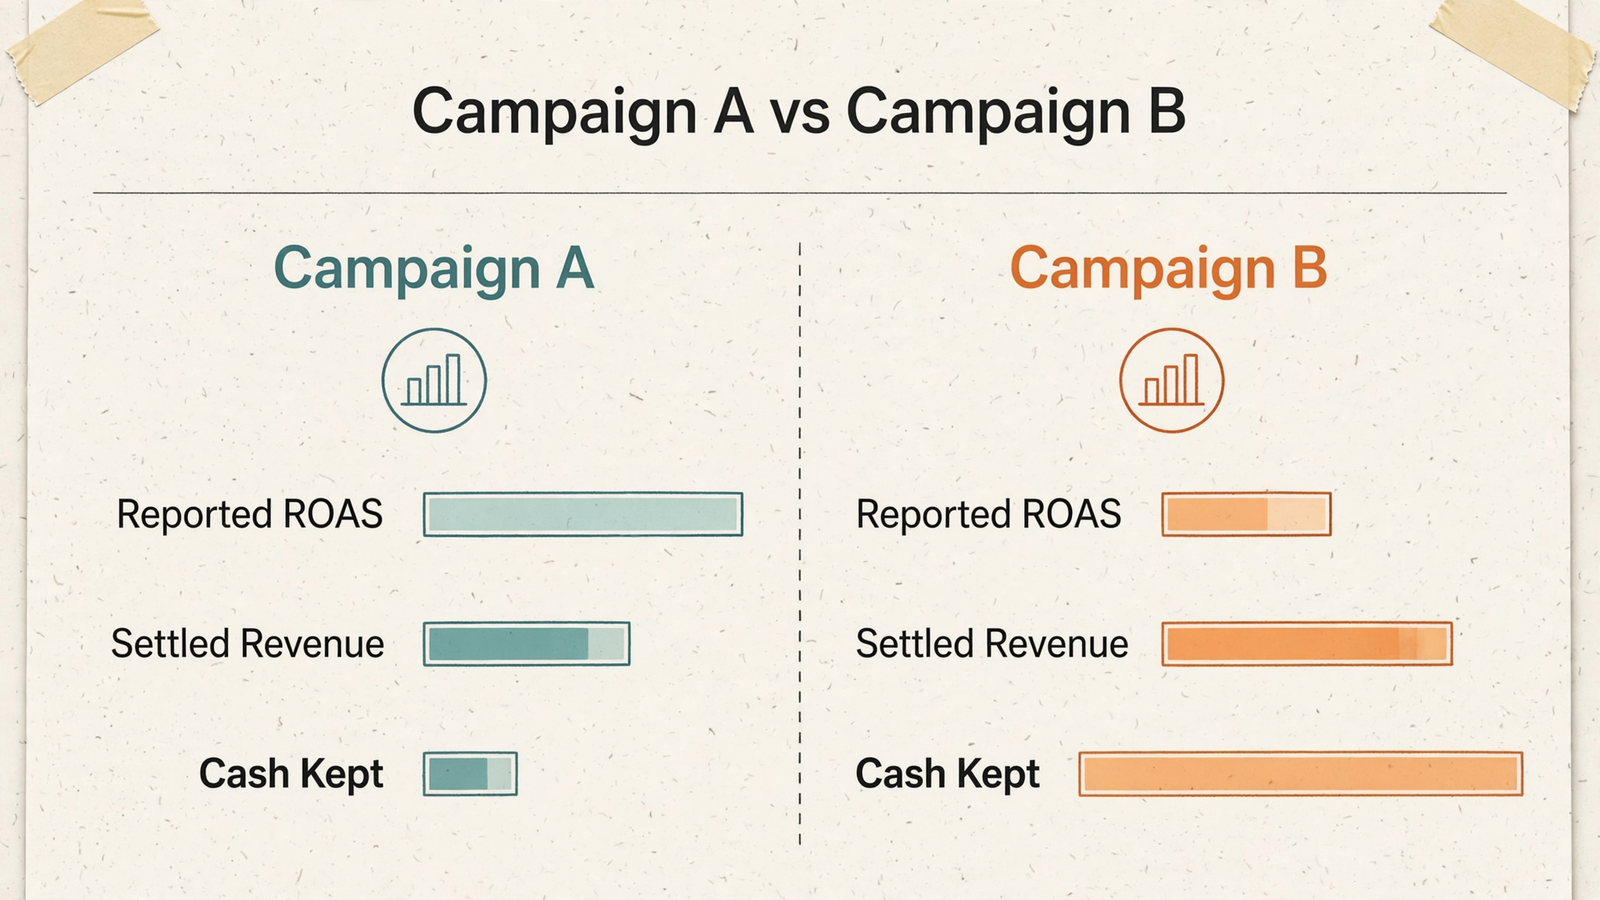
Campaign A sells a size-sensitive fashion bundle. In this example, returns refund 20% of its purchase value: $8k comes back out of the $40k. Settled revenue falls to $32k, so settled ROAS is already down to 3.2 while Ads Manager still shows 4.0.
Apply the 40% margin before ads and that $32k leaves $12,800 in contribution. Subtract the $10k ad spend. You have $2,800 left.
Campaign B sells a simpler replenishment product. Refunds take 3%, or $960, off its $32k in purchase value. That leaves $31,040 in settled revenue. At a 65% margin before ads, contribution is $20,176. Subtract the same $10k spend and $10,176 remains.
Lower reported ROAS. Nearly four times the contribution after advertising.
These are illustrative economics, not a claim that every replenishment product beats every fashion bundle. The point is the ranking: scale the screenshot and you scale the weaker business result.
Margin finishes the correction that refunds start
Two campaigns can produce the same settled revenue and leave completely different amounts available to pay for advertising. Product cost, pick and pack, shipping and transaction fees do not disappear because the ROAS column looks tidy.
That is why I rank ecommerce campaigns on contribution after refunds and costs, not gross ROAS alone. One practical version is profit on ad spend, or POAS: contribution before advertising divided by ad spend. On that definition, 1.0 means advertising consumed all the contribution.
Campaign A produces $12,800 in contribution on $10k spend. Campaign B produces $20,176 on the same spend. B is the business winner even though A photographs better.
Scale the money left after costs, not the prettiest ratio.
Use Meta to compare ads, not to overrule the ledger
Returns are not the only reason Meta and your store disagree. They also assign credit differently.
Under a 7-day click and 1-day view attribution window, Meta can credit a sale that your store records as direct. That creates another gap between platform reporting and business reporting. The useful distinction in this comparison of Meta ROAS and store profitability is the job each system should do.
I use Ads Manager to compare creative and audiences under the same attribution rules. I use the order ledger and P&L to judge profitability. When the question is what the business kept, the ledger wins.
That does not make platform reporting useless. It makes it a diagnostic rather than a spending verdict. A campaign can generate more attributed checkout value and still bring back the wrong product mix for the business.
For the sibling problem, where reported ROAS rises without extra orders, Meta ROAS Can Rise Without More Orders. Make Your Agency Explain Why. covers the visibility half. This is the money-kept half. Do not ask one dashboard number to settle both.
Do not fix the scorecard by starving the algorithm
The obvious correction sounds clean: stop sending revenue to Meta and send profit instead. Sometimes that is the right move. It is not an automatic fix.
The bidding system needs volume, speed and a useful spread of values to learn from. Profit after refunds arrives late and unevenly. Feed that signal in raw and you can build a technically purer conversion feed that arrives too slowly to steer spend.
I keep two numbers separate:
- The bidding input: a timely, stable signal the machine can learn from.
- The financial scorecard: settled contribution that tells me whether the spending worked.
The reasons not to blindly replace revenue with profit are practical. Frequent promotions can make profit values swing harder than revenue. Thin contribution leaves little room for error around break-even. Low conversion volume gives the bidder less to learn from.
And if margins and return rates are nearly identical across products, changing the feed may add plumbing without changing the ranking.
Optimize on a signal the machine can learn from. Judge on money you kept. Those are separate jobs, not competing philosophies.
Start with reconciliation, not a conversion-feed rebuild
I would not rebuild the conversion feed first for a low-volume account. Nor would I start there when product economics are so similar that the correction barely changes which campaign wins.
Start with monthly reconciliation and keep bidding on clean purchase value. Move toward profit-based inputs when margin spread is wide, return rates differ by product, and there is enough conversion volume for the bidder to learn.
That work still has a cost. Someone must pull order, refund and cost data, map it to campaigns, and keep it current. A spreadsheet correction that changes no decisions is another weekly chore. A correction that reverses the scaling order is management information.
Build the scorecard before rebuilding the signal. Plumbing without volume is just a slower way to lose.
Agree on a repeatable comparison, not a perfect match
You will not get Meta and your ledger to match to the penny. I would rather write down the attribution gap than spend another month pretending it can be eliminated.
Meta can claim credit through click and view windows. Your store can credit last click, a discount code, or a different source. Returns then arrive on their own schedule. Those differences do not excuse ignoring the ledger, but they do make perfect reconciliation the wrong target.
The useful rule is repeatable:
- Pick a recent 30-day spend window.
- Wait until its refunds and cancellations have cleared.
- Compare settled contribution by campaign with the platform figures for that same cohort.
- Repeat with the same definitions, attribution settings and agreed tolerance.
Write down what each column includes. Do not compare a mature cohort’s settled revenue with a fresh cohort’s checkout value and call the difference a trend.
Consistency beats false precision here. The job is to rank campaigns using the same economic rules, not force two different reporting systems to produce an identical total.
Give your existing agency a brief it cannot answer with screenshots
“Scale the highest-ROAS campaign” tells an agency to chase the dashboard number that ignores your costs. I would replace that instruction with a written brief tied to the ledger.
1. Send a mature cohort and its costs
Pick one recent 30-day spend window old enough for refunds and cancellations to clear. Send order totals, refund and cancellation totals by campaign, plus product cost and shipping by SKU.
Maturity matters. A preorder sale can appear in Meta weeks before its profit is known, because cancellations and fulfillment have not settled. Returns create the same timing problem. Do not crown a winner before its costs arrive.
2. Demand two views side by side
Ask for platform-attributed revenue and ROAS alongside reconciled revenue after refunds, then contribution after costs. Keep the views separate. No blending a platform revenue figure with a business cost figure and presenting the result as settled truth.
The agency should show the margin math, the cohort and the attribution limits. A screenshot is not a P&L.
3. Ask which campaigns still deserve the budget
After those adjustments, which campaigns and products clear their break-even requirements and leave contribution after ad spend? Name them. Show the calculation.
If the best-looking campaign drops to third, stop treating it as the first place to put another pound of budget. Cut spend there first. The point of reconciliation is to change a decision, not decorate the monthly report.
If the agency cannot answer, you do not just have a measurement problem. You have a management problem.
Scale the economics, or pay to grow the mistake
I want the commercial metric agreed before anyone touches budget: settled contribution after refunds and costs, measured on a mature cohort, with the attribution window and its limits written down.
The ledger will still be slower than bidding needs. Meta will still report purchase value that later gets refunded. Neither is permission to let the faster number make the spending decision while the slower number pays for it. That is how a 4.0 funds returns and a 3.2 funds payroll.
Keep gross ROAS where it belongs: a diagnostic for creative and audience comparison, not the verdict on what to scale. Then ask who owns the integration work. Refund and margin feeds do not wire themselves up.
If your Meta agency treats business economics as out of scope, believe them. That gap is why I moved toward execution grounded in business context, with an accountable record of changes, rather than another dashboard recommendation. That is the operating model behind groas.
An operator who wants to keep your money asks for refund files, SKU costs and shipping tables, then shows you which so-called winner falls apart after the adjustment. An operator who wants to keep your retainer defends the screenshot and calls the ledger messy. I know which one I would keep.
High ROAS that gets refunded is not performance. Ignore the ledger and you will scale the campaign that photographs best, refund the revenue you celebrated, and pay a percentage of spend for the privilege. It is a loan from your own warehouse. Scaling it just orders a bigger loan.


