

 LinkedIn

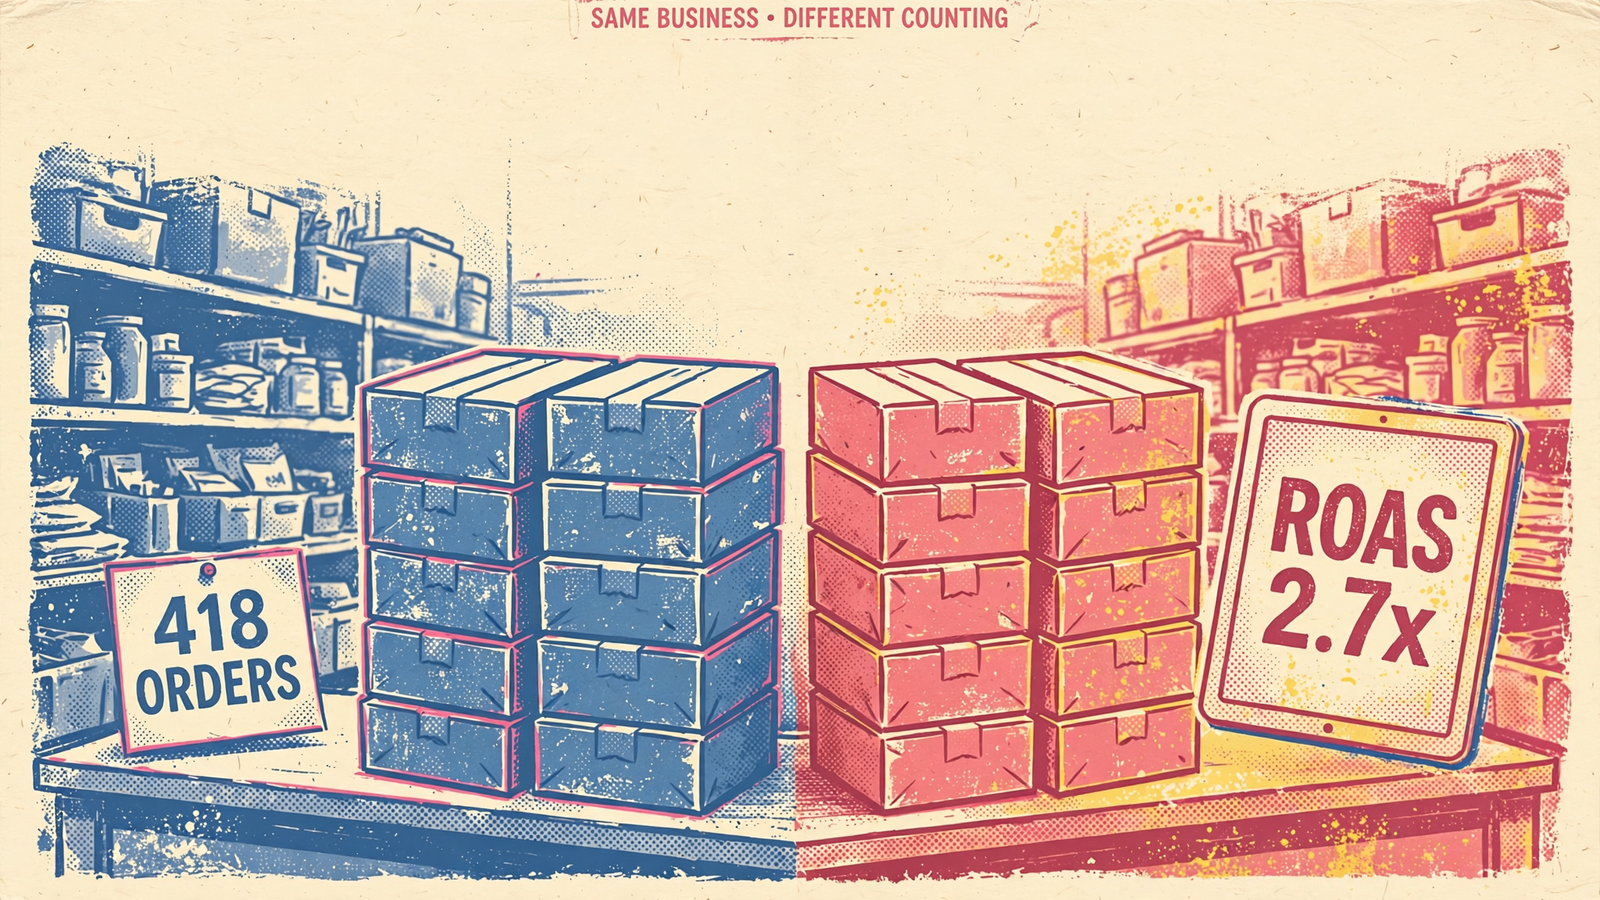
Shopify showed 418 orders. Meta showed ROAS climbing from 2.1x to 2.7x on almost the same spend. A store owner sent me those numbers last week and asked whether to let his agency scale the budget into Black Friday. My answer started with a less exciting question: did advertising produce more purchases, or did Meta get better at seeing the purchases already there?
Everything else follows from one calculation. ROAS is attributed purchase value divided by ad spend. If Meta credits more existing purchases to ads, the numerator rises. The store can stand still while the report improves. A company hired to improve ecommerce returns has to separate measurement recovery from commercial improvement before it claims a win or asks for more budget.
Free tool: the ROAS Calculator works out your return on ad spend, your break-even ROAS and the budget a revenue goal takes.
First, separate the purchase from the credit
Say you spend $10,000 in a month. Meta credits $21,000 in purchase value to those ads, giving you 2.1x reported ROAS. Then Meta gets better at matching purchases it used to miss. You still have 418 orders and the same store total, but Meta now credits $27,000 to your ads. Spend stays at $10,000. The report reads 2.7x.
I used to tell clients a jump like that meant we were finding more buyers. I was wrong often enough to stop saying it. The calculation tells you what Meta credited, not whether the campaign brought an additional person to the till.
The counting rules can change the answer even when the sales do not. Meta’s standard attribution window credits purchases within 7 days of a click or 1 day of a view. One demonstration shows the same $5,000 in spend producing 1.71x on 1-day click, 2.30x on 7-day click, and 3.06x on 7-day click plus 1-day view. Spend did not move. Sales did not move. The ruler did.
Before you call a higher ROAS a win, check whether the ruler changed.
Then ask what Meta started seeing in November
That distinction matters around holiday reporting. PPC Land reports that an Events Manager toggle called Measure conversions on customer devices switches on by itself from November 12, 2026. It adds an on-device matching path alongside server matching to recover purchases missing from reporting. No code change is needed, and it applies to datasets already sending events.
In plain English: Meta gets another way to connect a purchase to an ad. PPC Land warns that this may add sales to Meta’s reports that were missing before. Ads Manager could rise without the shop changing. That is the numerator effect, arriving at an awkward time for anyone deciding what to spend over Black Friday.
Confirm the setting and current platform documentation before acting. This is reported behavior, not a promise that every account will show a lift. The useful question is narrower: did the method of finding purchases change during the period being compared?
A recovered sale is still the same sale
A recovered conversion sounds like new business. It is not. It is a purchase that already happened and that Meta’s reporting now attributes to an ad. Its receipt was already in the store’s orders. Meta connected it to an earlier ad view or click. Whether that ad caused the purchase remains a separate question.
Go back to the owner with 418 orders. If 40 of those orders were invisible to Meta in October and become visible in late November, Ads Manager shows 40 more purchases from the same order file. Say that adds $3,200 in attributed value on identical spend. Reported ROAS rises. Nothing in that calculation establishes that 40 more people bought.
When the reported lift follows a measurement change, ask whether the extra value was found or earned. Check Events Manager and the account change history before discussing a budget increase.
Use three numbers, each for its own question
A store order, an attributed purchase, and an incremental purchase can refer to the same transaction. They answer different questions. Mixing them is how a report turns cleaner tracking into a supposed sales breakthrough.
Store orders and revenue answer what the business recorded. Use your Shopify or WooCommerce order data to check whether purchases and net revenue actually moved. The rules differ from Meta’s: Meta credits a purchase when its pixel or Conversions API sees it inside the attribution window, while Shopify assigns an order to a channel through referrers or tags. Shopify’s total-sales calculation includes discounts, reversals, taxes, and fees, and can include pending or unpaid orders. That is why I would check payment status, refunds, and cancellations before calling a store total money in the bank.
Attributed purchase value answers what Meta credits to advertising. For that figure to be useful, each Purchase event needs value and currency. A missing value or a duplicate event can distort the numerator. I have seen the duplicate often enough: pixel and Conversions API both send the purchase, but their IDs do not match. The mechanical fix is deduplication. Both paths need the same event name and event ID within Meta’s matching window so one sale is not counted twice.
Those first two numbers let you locate a reporting gap. Neither, by itself, tells you what would have happened without the ads.
Incremental revenue asks what the ads actually added
This is the question owners want answered, and no ordinary attribution report prints the answer by default: how many credited purchases would still have happened if the ads had not run? As one analytics breakdown puts it, Meta reports sales retargeting ads observe, not necessarily sales they cause. An ad shown to someone who had already decided to buy may receive credit. Credit is easy to assign. Cause takes a test.
A holdout gives you that test. Hold back a slice of eligible shoppers, compare revenue per shopper in the exposed group with the holdout, then scale the difference to the groups you are measuring. Divide that revenue gap by spend. The resulting incremental ROAS is (treatment revenue minus scaled control revenue) divided by spend.
Say a retargeting pool produces $50,000 in attributed value on $10,000 of spend. The dashboard prints a proud 5.0x. But if the holdout indicates that $38,000 in revenue would have arrived anyway, the measured lift is $12,000. That is 1.2x incremental ROAS on the same $10,000. One campaign, two answers, and potentially two different budget decisions.
A store-level sales check is useful when you do not have a holdout. It can tell you whether the business moved alongside Meta’s number. It cannot, on its own, prove the ads caused the movement. Treat attributed ROAS as a counting result until you have evidence of a business result.
Make the ROAS pitch start with a measurement audit
Any company that pitches we will improve your ROAS should be able to explain how ROAS is counted before it takes credit for changing it. I have watched agencies present a 30% lift that came entirely from moving the window from 1-day click to 7-day click plus 1-day view. That is not account management. That is a different ruler.
Ask for the changes during the comparison period, in order:
- Attribution: Did the window change, or did the November device setting switch on mid-test?
- Event coverage: Did Conversions API coverage or Purchase-event value and currency change?
- Deduplication: Were pixel and server events previously being missed or counted twice?
- Business results: On identical dates, what happened to store orders and net revenue after refunds and cancellations?

Put store orders and revenue beside Meta’s attributed purchases and value. Keep spend, date ranges, and attribution windows explicit. If Meta claims 60 purchases while the store shows 48 net orders, do not automatically treat either figure as the answer to the other’s question. You have a gap to explain before you use the report to justify scaling.
The incentive matters here. Ecommerce Meta agencies typically charge 10–20% of spend or a $1,000–$5,000 flat fee. Under a percent-of-spend model, the fee grows when the budget grows, whether or not the additional spend is profitable. A measurement lift alone is never a reason to raise that budget.
Check the business numbers Meta cannot recover into existence
Two useful cross-checks are MER and new-customer CAC. MER is total store revenue divided by total ad spend across channels for the same dates. New-customer CAC is spend divided by first-time buyers. Better Meta matching does not, by itself, add store revenue or first-time buyers to either calculation. That is why one pricing breakdown recommends reporting new-customer CAC and MER, not just platform ROAS.
These are cross-checks, not substitutes for an incrementality test. MER covers the whole business and its advertising spend; it does not isolate what one Meta campaign caused. New-customer CAC depends on a consistent definition of first-time buyer and the spend you include. Use them to spot a platform number moving alone, not to declare that every other channel was irrelevant.
If attributed ROAS climbs from 2.1x to 2.7x while MER stays at 1.9x and the new-customer count does not move, you may have cleaner counting. Keep the finding. Do not scale on it.
That is also the standard I would use to compare providers. With groas, Meta Ads management includes conversion tracking set up and checked, audiences and budgets worked around the clock, new ads tested and winners scaled, daily management, and weekly reporting. It costs a flat $1,499 a month with no cut of spend. A flat fee removes the percent-of-spend incentive; it does not turn attributed ROAS into incremental revenue. Compare groas with a percent-of-spend shop on MER and new-customer CAC over identical windows, with refunds removed, rather than accepting whichever platform screenshot looks better.
For a closer look at why the platform and store disagree, read Meta Says 4.5x ROAS. Your Store Says 1.8x. Here’s Where the Gap Comes From.
Better measurement is useful. It is not another customer.
I want cleaner counting. When Meta matches more purchases you already earned, its bidding has a fuller file to learn from, and weekly reads can become less jumpy. Missing data is not a virtue. But a fuller file does not put another order into Shopify. It moves an existing order from unseen by Meta to seen by Meta.
That distinction controls the spend decision. If a provider treats found value as earned value and answers every reported lift with more budget, you risk paying more to reach the same buyers. Before holiday spend peaks, ask how purchase-value gaps get investigated. In my checks, that means holding the attribution window constant, verifying Conversions API coverage and deduplication, checking value and currency on Purchase events, removing refunds and cancellations from the store comparison, and placing store net revenue beside attributed value for identical dates.
Groas does the tracking and testing work inside Meta Ads management: tracking checked, budgets and audiences worked daily, creative tested, and weekly reporting on what moved. It does not offer custom finance reconciliation or promise that every recovered conversion was caused by an ad. No management company can establish that from a dashboard. Take the better measurement; do not mistake it for proof of more customers.
Now run December through the same model
Take a fresh case. An agency reports November at 2.4x on $12,000 of spend and early December at roughly 3.1x on $12,400. It recommends a 40% budget increase into Christmas. Work through the three questions before agreeing.
First, did the counting change? Check whether the customer-device setting switched on, the attribution window moved, or Conversions API coverage and deduplication changed. Hold the window constant. Put four figures on one page: store net orders, store net revenue, attributed purchases, and attributed purchase value.
Now say the store records 510 net orders and $76,000 in net revenue in November, then 524 net orders and $78,100 in December. Meta’s attributed value rises from $28,800 to about $38,400. Credited value is up about 33%; store revenue is up about 3%. The store did improve, but not at the rate the Meta report suggests.
Next, price that business result. On the stated spend, MER moves from 6.33x to 6.30x, essentially flat. First-time buyers move from 212 to 218. Those numbers do not prove that the ads produced no additional customers. They do tell you that a large jump in credited value has not appeared as a comparable jump in the store-level checks.
So keep the cleaner tracking and keep testing creative. Hold the proposed budget increase until MER and new-customer count move with attributed ROAS for two full buying cycles, or a holdout gives you a stronger reason to act. If a company hired to improve returns cannot walk you through that page in plain language, it is selling you the numerator. Make it explain the difference.


