

 LinkedIn

A “3x ROAS in 60 Days” Meta agency case study can make a flat account look like a turnaround. I picked the familiar one-page PDF for this teardown because it reaches buyers before the proposal does: skincare jar or supplement pouch at the top, three stats under a huge headline, a happy founder quote, then a Book a Call button.
I am not quoting one agency’s PDF. This is a composite of the same lines I have seen under different logos, arranged in the order a buyer encounters them. Each line has a verdict. The question is not whether the multiple looks good. It is whether the page gives you enough information to tell what changed.
The artefact: a one-page PDF that looks like proof
First comes the before-and-after: 1.1x becomes 3.2x in 60 days. Then three badges: spend scaled, CPA down, creative refreshed. A founder says the team felt heard; a calendar link waits underneath. If you spend $20k a month on Meta and want an agency to improve ecommerce returns, it is an efficient page. You understand the pitch in seconds.
That efficiency is also the problem. The PDF gives you the result before it gives you the conditions under which the result was measured. A screenshot of Ads Manager is not, by itself, evidence of business growth. The spend, dates, attribution setting, customer mix and margin would make it useful evidence. Most are off the page. Here is what the page earns, line by line.
Piece 1: “3x ROAS” depends on the ruler
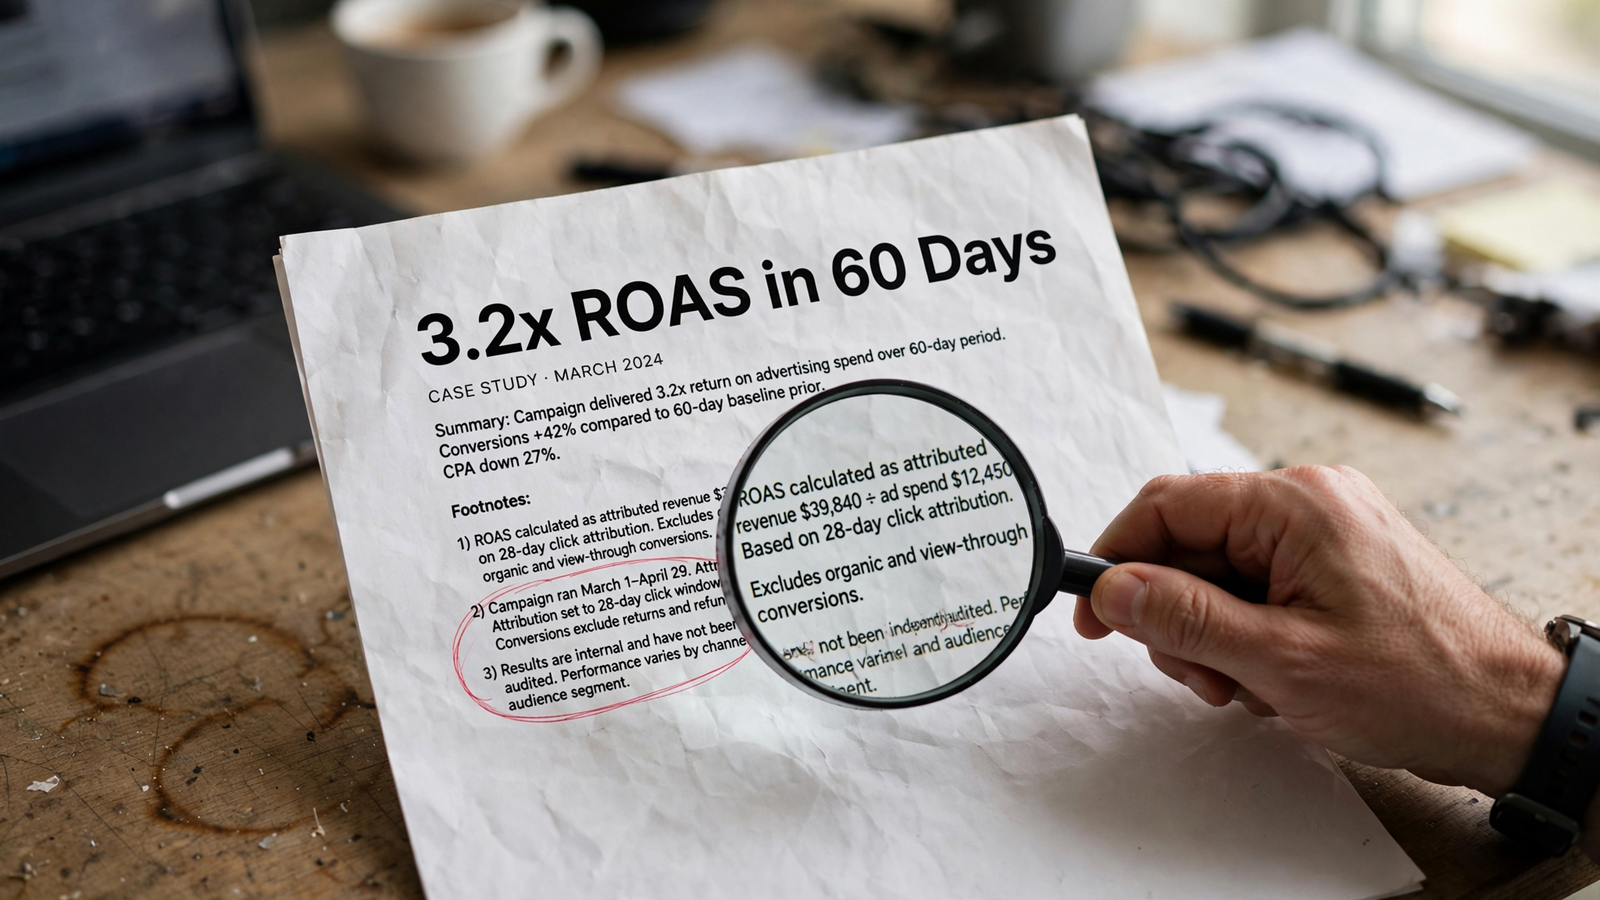
The headline says 3x. The first place I look is the attribution setting. Meta can count purchases within 7 days of a click or 1 day of a view, even when nobody clicks. Change that window and reported ROAS changes without a corresponding change in orders.
Free tool: the ROAS Calculator works out your return on ad spend, your break-even ROAS and the budget a revenue goal takes.
One worked example holds spend and the week constant: 1.71x on 1-day click, 2.30x on 7-day click, and 3.06x on 7-day click plus 1-day view. That is not three different weeks of selling. It is three ways to credit the same week. The setting cannot tell you, on its own, how many purchases the ads caused.
Verdict: the multiple is incomplete without its attribution window. I used to tell clients that 3x was a win. I was wrong to stop there. If the before uses 1-day click and the after uses 7-day click plus view, the agency has changed the ruler. Ask for both settings before you compare the two numbers.
Piece 2: The ugly “before” needs its own explanation
Next comes 1.1x, sometimes 0.9x or 0.8x, usually with a sad gray arrow. A low starting point makes the climb persuasive. It does not explain why the account started there.
In accounts I have inherited, the cause has sometimes been mechanical: a budget cut during a stockout, a pixel firing twice, or spend left running after the client paused best sellers. Duplicate Purchase events can nearly double reported purchases. One audit found 330 Meta purchases against 180 real store orders; the reported ROAS read 2.57x before the fix and 1.59x afterward on identical spend. A measurement problem can distort the apparent baseline in either direction.
Verdict: a low baseline is a starting condition, not proof of agency skill. If the before period includes a collapsed budget, broken tracking or a short window chosen for maximum pain, the jump may describe recovery rather than growth. Ask what broke, when it broke and what the agency fixed. No dates and no fix log means no convincing turnaround story.
Piece 3: “Spend scaled” is not a spend figure
The third line is often a badge that says spend scaled. Look for dollars and exact dates beside it. If neither appears, you cannot tell whether the agency improved the account at the level you actually need to spend. Spend level and date range belong alongside attribution and the new-versus-returning split.
I have seen the mechanism from inside: cut a messy $30k account to $8k, stop losing prospecting campaigns and let retargeting pick up the leftovers for three weeks. Reported ROAS can triple while total revenue falls. The screenshot still has an impressive multiple, but the business has not got bigger.
Verdict: without spend in dollars, “scaled” is an adjective doing a number’s job. A 3x at $5k tells you little about what happens at $20k. The PDF does not prove the before was starved or the after failed to scale; it simply leaves you unable to rule either out. Ask for before spend, after spend and exact dates.
Piece 4: Meta’s revenue is not the store’s revenue
The screenshot shows Meta-attributed revenue. Your store records orders. Those numbers answer different questions, especially when Meta, Google and email claim credit for the same order. View-through attribution can widen the gap: in one example, removing it takes a reported 4.2x to about 2.9x without changing the orders placed.
Then there is incrementality: how much revenue would not have happened without the ads? Haus case studies summarized by EightX put platform-reported ROAS above measured incremental ROAS. A cropped platform column cannot settle that question. Nor does a store revenue total, by itself, identify which orders the ads caused. It does give you an essential check against the platform figure.
Verdict: ask for store revenue over the same dates and in the same currency, with refunds removed. Then ask what, if anything, the agency did to measure incremental lift. If the only answer is a cropped Ads Manager column, you have an ad for the agency, not a complete case study.
Piece 5: “Purchases” does not mean new customers
The next line says purchases. It rarely says whose. Retargeting can collect orders from people already likely to buy, lifting reported ROAS without doing much for acquisition.
One audit compared an ad at 6.89x standard ROAS with 0.81x incremental ROAS on new audiences. Another showed 3.81x standard ROAS and 2.15x incremental. Once the results were split using Audience Segments and checked against Incremental attribution, the apparent winner was no longer the better acquisition choice. Same account; different decision.
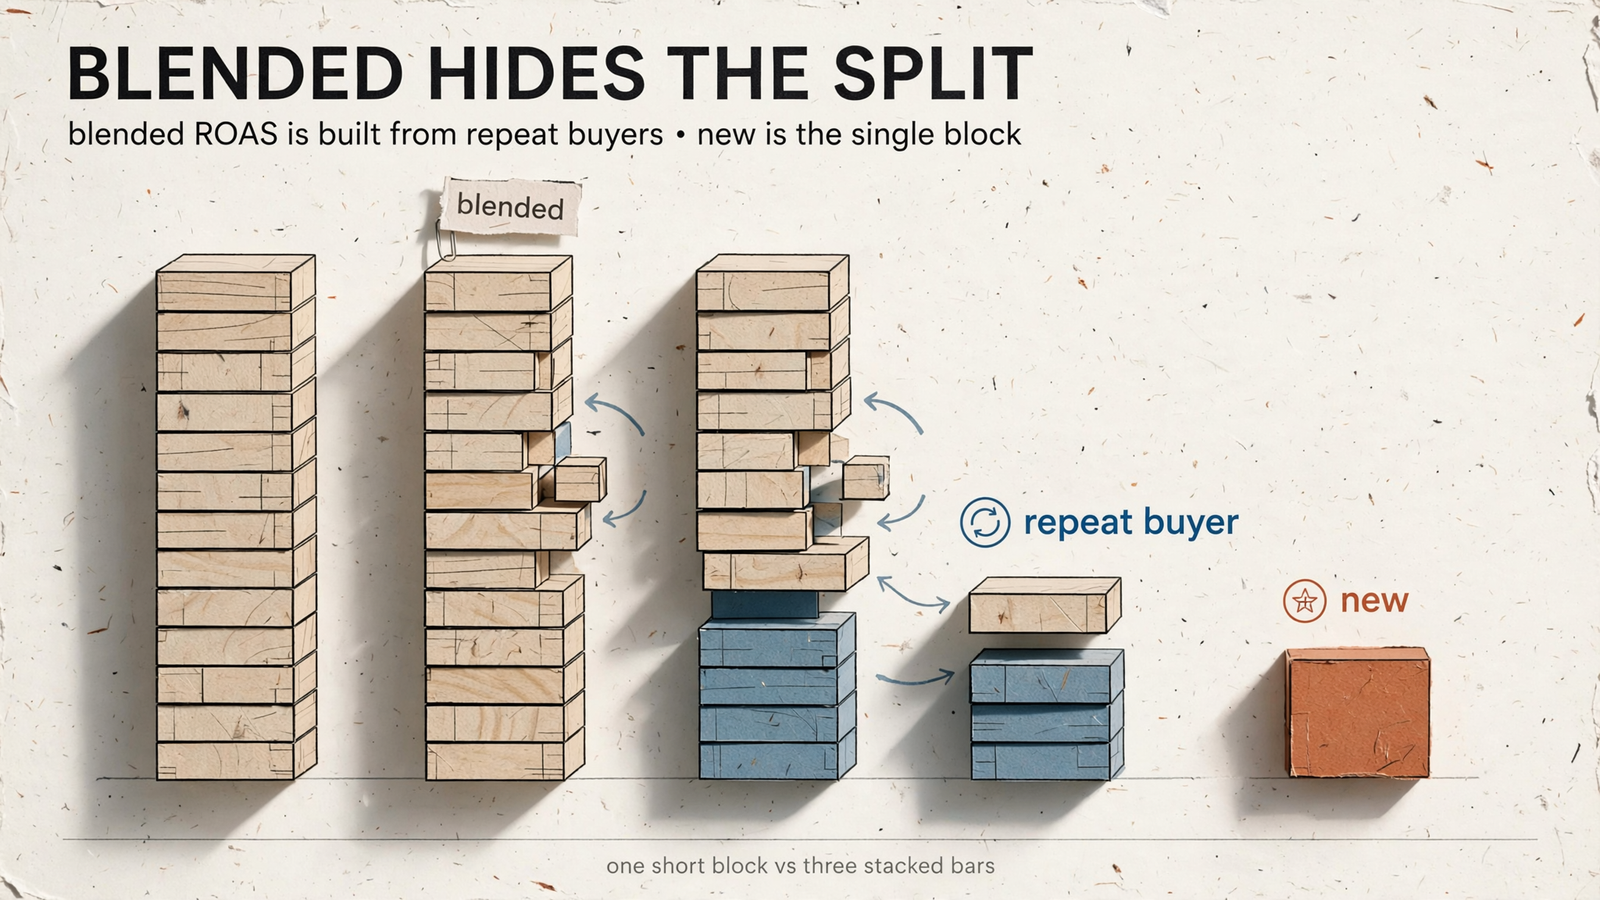
The account-level version is simpler. Blended CAC divides spend by all purchases, so it can understate the cost of acquiring someone new. In one illustrative audit, about 2,600 purchases on roughly Rs 6 lakh of spend looked like Rs 230 per purchase. With 25% returning buyers, only about 1,950 purchases were new; new-customer cost was about Rs 305, roughly one-third higher. I have seen brands celebrate a 3x sale month that was 60% repeat buyers. That is not the same as acquiring customers at 3x.
Verdict: demand the new-versus-returning split and new-customer ROAS. I have written about this stall pattern in Your Meta Agency Can Raise ROAS While New-Customer Growth Stalls. If new-customer returns are flat, do not let blended ROAS stand in for growth.
Piece 6: “Creative refreshed” leaves out who made it
In the middle of the page, creative refresh or full-funnel creative testing suggests the agency made the ads. Sometimes the client supplied six phone-shot videos and a folder of old UGC, while the agency cut them into 4:5 versions, added captions and ran variants. I have been on both sides of that exchange. Selecting and testing those variants is work. It is not the same work as producing the underlying creative.
The case study rarely says who supplied what, how many concepts were truly new, who paid for shoots or whether a holdout tested the effect. Without that detail, the agency gets credit for a result without showing its contribution to the creative behind it.
Verdict: ask for net-new concepts versus re-cuts, and ask who paid for production. If the best ad began as your footage, the case study should not imply the agency created it. Give the operator credit for the work it did, not the work its client did.
Piece 7: A real 3x can still lose money
Even if every attributed order is sound, ROAS divides revenue by ad spend. It does not pay for the product, shipping, transaction fees or refunds. That is why break-even ROAS is 1 divided by margin: at 40% margin it is 2.5x; at 30%, about 3.3x; at 20%, 5.0x. Use the margin that reflects the costs relevant to the decision. A headline cannot tell you whether your store clears its break-even point.
One phantom ROAS example puts £48,000 of Meta-reported revenue against £11,400 of spend: 4.2x. After removing view-through credit, cross-platform duplicates and re-acquired traffic, the example assigns £32,000 to incremental revenue, or about 2.8x. At a 30% margin, that is below the roughly 3.3x break-even point, not a profitable win.
Verdict: the multiple needs margin math beside it. A store with 25% margin after freight loses money at 3x before you add an agency fee. Send your break-even figure before the call and ask the agency to show how its result clears it. Beating the number on the PDF is not the same as making you money.
What I would keep from the PDF
Not all of it is fiction. A good operator can repair tracking, cut obvious waste and separate new from returning buyers so you can finally see what prospecting costs. Sometimes the most useful early result is a lower, more honest reported number. That gives you a baseline you can work from instead of a flattering error.
Keep the mechanism, not the decoration: what was broken, what changed and what the result excludes. A founder feeling heard may be true. It does not explain the 3x. Neither does a badge labelled full-funnel. The rest is what the deck calls synergy. I call it two people counting the same order.
Eight questions to send before the sales call
Paste these into a reply to the PDF. Ask for numbers and screenshots rather than another adjective or a call to “walk you through” the result. The order follows the case study, from its headline to the profit it claims to create.
- What attribution setting was used before and after, for clicks and views? Watch for a before on 1-day click and an after on 7-day click plus view.
- What was spend in dollars before and after, and what were the exact dates? “Scaled spend” is not an answer.
- What was store revenue for those same dates, with refunds removed? Do not substitute Meta-attributed revenue.
- What share of purchases came from new versus returning customers, and what was new-customer ROAS? Blended ROAS hides that split.
- What was broken in the before period: tracking, stock, budget or the chosen window? A repair needs a different label from growth.
- How many net-new creative concepts did you produce versus re-cuts of client footage? Ask who paid for shoots.
- Was there a holdout, geo test or incrementality read, and what did it show? Platform attribution alone does not answer this.
- What margin made that ROAS profitable, and what was the brand’s margin? This is the line most worth checking: if break-even was 3.8x, three months at 3x can still cost you money after product, shipping and refunds.
That last omission is why I judge these case studies by what they leave out, not by the multiple they print. Any shop can crop a 3x from Ads Manager. The one I would hire puts store revenue, new-customer returns, spend in dollars and margin math on the same page, with the changes logged so I can see what moved. That is the standard groas sets: continuous execution tied to business results, not a screenshot offered as the result. If the PDF in your inbox cannot meet it, close the tab.


