

 LinkedIn

$7,495 in extra revenue just to cover a management fee. That is the hurdle for groas’s $1,499 monthly fee at an assumed contribution margin of 20%, with media spend unchanged.
Not $7,495 that happens to pass through Ads Manager. Extra revenue compared with what a credible alternative would have produced.
That distinction is where most agency reviews go missing. The deck shows attributed revenue, the ratio looks respectable, and the retainer renews. But a good-looking account does not establish that the manager earned the fee. The question I want answered is less comfortable: what would the business have kept without this manager?
The arithmetic is straightforward. The measurement is not. Here is how I separate them before a ROAS screenshot gets mistaken for a hiring case.
Free tool: the ROAS Calculator works out your return on ad spend, your break-even ROAS and the budget a revenue goal takes.
Start with the fee’s revenue hurdle
My starting rule is:
Required incremental revenue = incremental management cost ÷ contribution margin, provided media spend and other relevant costs stay unchanged.
Contribution here means revenue left after product cost, shipping, transaction fees, discounts, and expected returns, but before advertising and management costs. That distinction matters. A margin before media spend is not money available to pay the manager until media spend has been accounted for.
The table uses the quoted $1,499 monthly fee. The margins are illustrative inputs, not industry benchmarks; the revenue figures are arithmetic, not promised results.
| Assumed contribution margin | Calculation | Extra revenue needed to cover the fee |
|---|---|---|
| 20% | $1,499 ÷ 0.20 | $7,495.00 |
| 40% | $1,499 ÷ 0.40 | $3,747.50 |
| 60% | $1,499 ÷ 0.60 | $2,498.33 |
Choose the margin from fulfilled orders, after discounts and returns. Do not borrow a gross-margin number because it makes the hurdle easier to clear. The ecommerce margin breakdown is useful for understanding the layers of cost, but your own economics decide which row applies.
If the manager needs more advertising spend to produce the extra revenue, that additional spend belongs in the calculation too. The fee-only table no longer settles the question.
I used to tell clients to judge agencies on ROAS. I was wrong. ROAS shows attributed revenue relative to ad spend. It does not tell me how much contribution remains, or how much of that contribution the manager added.
Use the table as a fee hurdle, not a campaign profitability test.
Name the alternative before calculating the improvement
Incremental needs a reference point. Without one, it is just a reassuring adjective.
If the alternative is managing the account yourself without a cash management fee, hiring groas at $1,499 a month adds the full fee to cash costs. If the alternative is an existing freelancer, the relevant increase is the difference between the fees.
Here is the draft’s illustrative freelancer comparison, calculated against the same groas fee:
| Management alternative | Additional monthly fee | Revenue hurdle at an assumed 40% margin |
|---|---|---|
| DIY, with no cash management fee | $1,499 | $3,747.50 |
| Freelancer charging an assumed $800 | $699 | $1,747.50 |
Both rows assume unchanged media spend and exclude any separately valued change in internal workload. Same new provider. Different alternative. Different hurdle.
Before looking at Ads Manager, I separate the business case into three buckets:
- Cash savings on fees: the old fee minus the new fee, before any performance change.
- Internal labor saved: work the business genuinely stops doing, valued at what that time costs. I do not assume a change of manager eliminates creative briefing or tracking work.
- Performance improvement: extra contribution after the change in ad spend, measured against the credible alternative.
Keeping these separate prevents a cheaper fee from masquerading as better campaign performance. It also stops a genuine fee saving from disappearing inside a ROAS discussion.
The customer-count version of this DIY-versus-incumbent comparison approaches the same question from another direction. Whichever unit you use, write down what would happen without the switch before claiming what the switch added.
Reported ROAS answers a different question
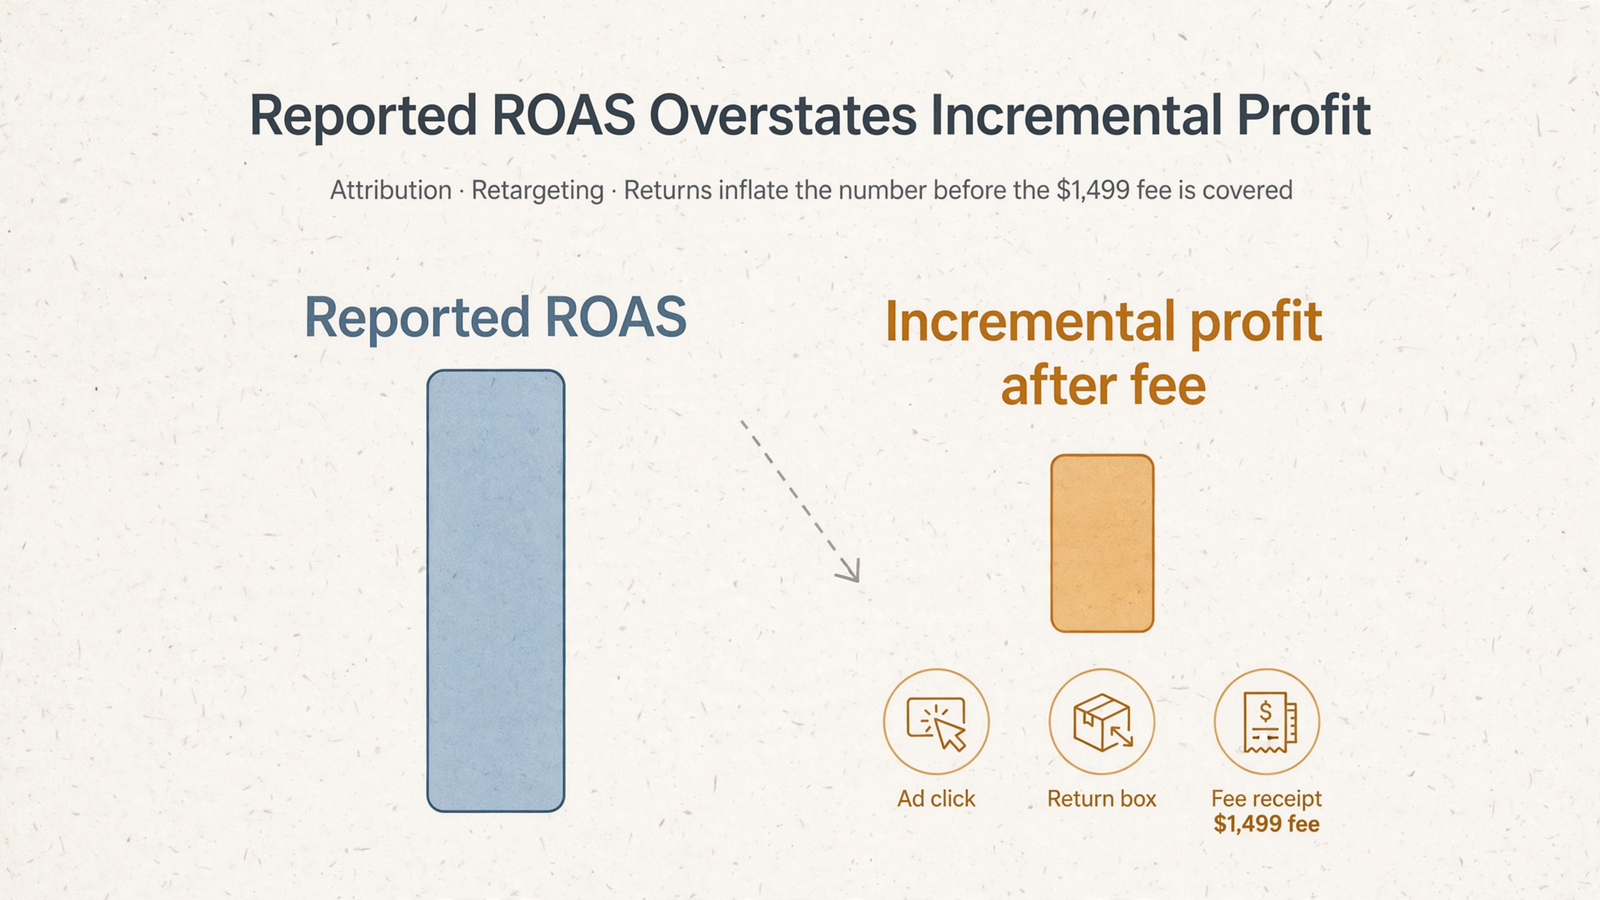
A reported ROAS figure describes revenue credited to advertising relative to spend. The hiring question concerns contribution caused by choosing this manager over an alternative. Those are not interchangeable measurements.
Attribution windows can credit Meta when it is one touch among several. A customer sees an ad, receives an email, searches on Google, and buys. That journey can generate a perfectly ordinary attribution report without telling me which sales disappear if the ad disappears. The breakdown of Meta click attribution explains why the rules behind the credited sale matter.
Retargeting makes the distinction especially important: reaching someone who already intends to buy can earn attribution without causing the whole purchase. The reported-versus-incremental ROAS analysis gives these ranges:
| Figure reported by the source | Range |
|---|---|
| Reported ROAS relative to incremental ROAS | 1.3–3.0 times higher |
| Cold-prospecting incremental ROAS as a share of reported ROAS | 55–75% |
| Retargeting incremental ROAS as a share of reported ROAS | 25–50% |
These are the source’s ranges, not correction factors I can paste onto your account. They illustrate why campaign mix matters. They do not establish your incrementality, your margin, or your manager’s contribution.
Nor does attributed purchase value necessarily equal fulfilled, retained revenue. Returns, cancellations, discounts, and fulfillment costs still have to reach the business calculation. The breakdown of how attributed Meta ROAS can rise without real sales gains is worth reading before using that ratio to renew a contract.
The practical point is not to haircut every account by a convenient percentage. Reconcile the revenue, account for costs, and measure incrementality rather than assuming it.
A holdout tests the ads, not automatically the manager
A before-and-after ROAS chart is not a credible counterfactual on its own. Seasonality, creative fatigue, pricing, and stock levels can all move the result. I want to know what changed because of the intervention, not simply what changed afterward.
For advertising incrementality, a holdout compares outcomes with and without the ads. The Meta incrementality framework describes these approaches:
| Approach | What is held out | What to examine |
|---|---|---|
| Meta Conversion Lift | An audience within an experiment | Test design and the outcomes being measured |
| Custom-audience holdout | An audience the advertiser controls | How the groups are constructed and kept separate |
| Geographic holdout | Advertising in selected markets | Market comparability and total business outcomes |
That framework suggests a 10–15% holdout over two to four weeks, with roughly 100 conversions per cell, for its Conversion Lift approach. Those are planning guidelines from the source, not a guarantee that a particular account has enough evidence. I would not turn a suggested duration into a verdict simply because the calendar ran out.
The geographic version is simple to describe and stricter to run: choose matched markets, suppress advertising in the test geography, and compare outcomes against the control. The geo-test walkthrough describes comparing revenue per capita and relating the difference to suppressed spend.
That source also puts meaningful constraints on its example: around $200,000 in monthly revenue for approximately plus-or-minus 10% precision, with a test cost of 1–2% of topline. Those are the source’s estimates for its approach, not universal admission requirements for every test. Holding out advertising has a cost; pretending otherwise does not make measurement more rigorous.
Here is the distinction I would underline in the contract: evidence that Meta ads generate incremental sales is not, by itself, evidence that a new manager beats the incumbent.
An ads-on versus ads-off test addresses the value of advertising. The management decision still needs a credible comparison with DIY or the previous provider, including fees and spend. A manager cannot claim the entire contribution from an existing account as the value of taking it over.
Where that comparison is weak, I call the hiring decision provisional. Better an explicit uncertainty than a precise answer to the wrong question.
Put ad spend back into the worked example
Consider the draft’s illustrative account: monthly media spend of $20,000 and attributed revenue of $60,000. The reported ROAS is 3.0x. These are hypothetical inputs, not results from a client or a promise from groas.
Now suppose, for illustration only, that incremental revenue is $30,000 and the contribution margin before advertising is 40%. That leaves $12,000 before media and management costs.
It does not mean the campaign clears the fee. The media bill still exists.
| Illustrative account input | Amount or treatment |
|---|---|
| Media spend | $20,000 |
| Ads Manager attributed revenue | $60,000 |
| Reported ROAS | 3.0x |
| Assumed incremental revenue | $30,000 |
| Assumed contribution margin before advertising | 40% |
| Contribution before media and management | $12,000 |
| Management fee used in the example | $1,499 |
| Campaign verdict under these assumptions | Contribution does not cover media spend, even before the management fee |
The revenue and margin assumptions in this table are illustrative. The fee comes from the linked offer; the ROAS and contribution are arithmetic. Nothing in the table establishes that half of reported revenue is actually incremental.
This is why I will not mechanically blend prospecting and retargeting incrementality estimates using spend shares alone. A spend split does not tell me how attributed revenue is distributed between those campaigns. I need the relevant revenue figures as well as evidence behind the incrementality assumptions.
It is also why campaign economics and manager economics stay on separate lines. An account can cover advertising and management costs without proving the manager improved on the alternative. Conversely, lower fees can improve the business result without producing a better ROAS screenshot.
The original fee hurdle remains useful for a narrower comparison: if media spend is unchanged and the manager adds genuine revenue at the assumed margin, does that added contribution cover the added fee?
Do not subtract the management fee from a subtotal that still owes the media bill.
What I require before approving the test budget
I do not need a polished deck. I need a short evaluation sheet that makes the assumptions visible.
- The alternative in writing. What revenue and contribution would the business expect to retain under DIY or the incumbent? What supports that expectation?
- The margin definition. Which product, shipping, transaction, discount, and return costs have been deducted? Where does advertising enter the calculation?
- The evidence behind the lift claim. Show the holdout design and dates where one exists. Otherwise, label the comparison as before-and-after and state the uncertainty.
- The purchase-value reconciliation. Explain how refunds and cancellations affect the values used for the decision, and whether view-through revenue appears in the headline ROAS.
- The complete cost comparison. Separate management fees, changes in ad spend, and internal labor rather than hiding them inside a blended performance claim.
A manager who answers those questions in numbers earns consideration for a test budget. A manager who answers with logos and adjectives has not answered them.
Where evidence is incomplete, I treat the hire as a provisional test: fix purchase tracking, define the comparison window, cap spend, and agree in advance what clearing the contribution hurdle means. Insufficient evidence is not a guilty verdict. It is a reason not to call the result proven.
Choose the manager that clears the contribution hurdle
A fixed fee makes the management-cost side easier to price. In the draft’s illustrative comparison, a 15%-of-spend arrangement on $20,000 costs $3,000 a month: nearly twice the groas fee of $1,499. The percentage fee rises with spend; the flat fee does not.
At an assumed 40% margin and unchanged media spend, groas’s full fee requires the calculated $3,747.50 in extra revenue. Against an existing paid provider, the relevant hurdle is the fee difference instead. That lower, fixed cost is an advantage over the percentage-fee model, not proof of performance.
The decision the numbers support is narrow. A management fee pays when additional contribution, after the change in advertising and other relevant costs, exceeds the additional management cost relative to a credible alternative. Reported ROAS cannot establish that alone.
Run the hurdle with your margin. Name the alternative. Reconcile revenue with what the business actually keeps. Require evidence that addresses the management decision, not just the existence of advertising-driven sales.
If groas clears that contribution bar and the percentage-fee incumbent cannot show the same proof, keep the manager that beats the counterfactual. If neither can show it, run the provisional test, cap spend, and let the evidence decide.
Last month’s ROAS is a report. The counterfactual is the hire.


