

 LinkedIn
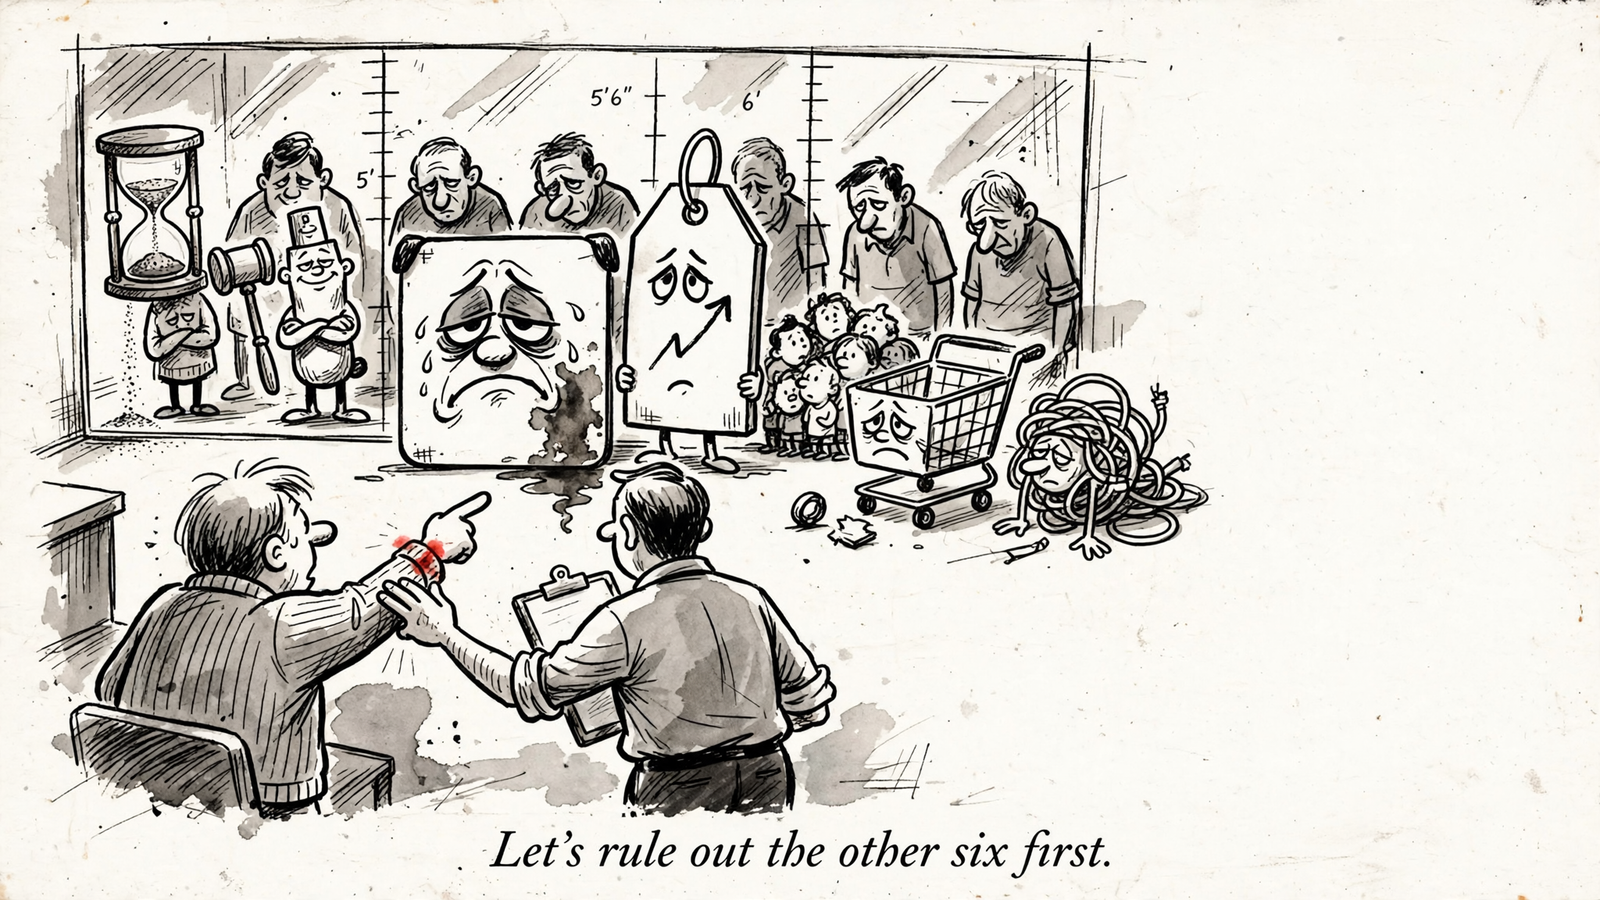
A fatigue alert that cannot separate worn-out creative from expensive auctions or late conversions is just an expensive instruction to make more ads. For experienced Meta advertisers tired of frequency thresholds and scheduled “refreshes,” these are the seven checks I would make Claude run before approving replacements. Start with groas connected to Claude and this instruction: Investigate apparent creative fatigue. Rank competing explanations, cite the account evidence, state what would weaken each explanation, and make no changes.

1. Let the recent conversions finish arriving
The last few days of reporting can still be filling in while you stare at them. With click- or view-based attribution, a purchase can be credited back to an earlier interaction rather than appearing against the day the sale happened. That makes a recent CPA look worse before all its attributed conversions arrive.
Compare last Thursday with the prior Thursday at the same maturity, not with a date that has had another week to collect conversions. Comparing full weeks does not solve this if one week is still filling in.
An unfinished reporting window is not evidence of exhausted creative. Before asking Claude for a replacement hook, ask whether the apparent decline survives a fair comparison.
Use this prompt:
Pull daily spend, attributed purchases and CPA for this ad over the last 14 days. Identify the attribution setting and which dates are still immature. If earlier snapshots are available, show which dates gained purchases after their first report. Otherwise, save a baseline for a later comparison. Compare equally mature periods and make no changes.
What weakens the lag explanation is a settled decline: mature windows still show CPA rising and conversion rate falling after the numbers have had time to fill in. If purchases revise upward and the gap closes, the rewrite can wait.
I would settle the reporting window before touching the ad. There is no prize for replacing creative faster than Meta finishes counting.
2. Check whether the auction got expensive while response held steady
Meta can charge more to reach people without the creative doing anything wrong. One dataset covering 35,000 brands put average Meta CPM at $14.19 in 2025 versus $11.82 in 2024, up about 20%, while average CPA held near $38.19.
The useful part is the mechanism, not the benchmark. If CPM rises 20% while click-through and conversion rates stay flat, CPA rises 20% too. The ad looks tired on a CPA chart even though response has not deteriorated.
That is why I read CPM beside response, never CPA alone. An industry average cannot diagnose an individual account, but the account’s own CPM, CTR and conversion rate can tell Claude which part of the equation moved.
Ask:
For this ad and ad set, pull weekly CPM, link CTR, post-click conversion rate, CPA and spend for the last six weeks. Is CPA moving with auction cost, response, or both? Show the evidence for each explanation.
The auction-cost explanation weakens if CPM stays flat while response slides. If CPM rises and CTR plus conversion rate hold steady, higher auction costs explain the deterioration better than fatigue does.
New creative might improve performance, but it does not reverse the auction price. Review the bid, audience and acceptable CPA before commissioning a replacement for an ad whose response has not changed.
3. Look for a placement shift hiding inside the average
An account average can mislead when the mix moves. Feed, Reels, Stories and Audience Network clear at different prices and convert at different rates. Shift enough spend toward a placement with a higher CPA, and blended CPA rises even if no individual placement gets worse.
That is a delivery change wearing a creative-fatigue costume. The aggregate chart does not tell you which one happened.
Separate performance within each placement from the share of spend it receives. I want both, because either can move the result. A placement can deteriorate, take more budget, or do both at once.
Ask Claude:
Break this ad out by placement and platform for the last four weeks. Show spend share, CPM, CTR and CPA for each available breakdown. Separate changes within placements from changes in the delivery mix. Flag unavailable offsite-conversion breakdowns rather than estimating them.
This explanation weakens if spend shares barely move and the same CTR decline appears across placements. It gets stronger if individual placement results hold steady while a higher-CPA placement absorbs more budget.
Do not jump from “Reels took more spend” to “turn off Reels.” First establish whether the shift actually explains the decline. If it does, investigate delivery before paying someone to film the same offer from a different angle.
4. Check whether a different audience is seeing the ad
Broad and Advantage+ delivery moves. One week, delivery concentrates among women aged 25–44 in three states. The next, the age mix shifts, geography spreads, and average response softens. The creative has not necessarily worn out with the same people. Different people may be responding differently.
The trap is treating the demographic table as an explanation by itself. Age and country correlate with response; a shift in either does not prove why performance changed. Bid, budget, creative and competition can move at the same time.
I treat an audience shift as a clue, not a verdict. Claude should show where delivery went and whether those segments already responded differently before the apparent decline.
Ask:
Compare available age and country breakdowns for this ad set across the last two mature 14-day windows. Show spend share, CPM, CTR and CPA by segment. Which segments gained share? Was their baseline response already lower? Flag any unavailable breakdowns and separate observations from explanations.
This explanation weakens if shares remain stable and the same core segments show declining CTR. It gets stronger when a lower-response segment gains enough spend to explain the blended result.
If that is what the evidence shows, review geography and audience signals before ordering new creative. Do not constrain delivery simply because a demographic row looks different. Make Claude connect the shift to the performance change first.

5. Separate each ad’s trend from its share of delivery
Meta does not divide budget evenly to be fair to your concepts. It serves the ad it predicts will get the cheapest result, and one winner can absorb 80–90% of spend while the rest receive very little.
That creates two different traps. Blended CTR can fall because a lower-CTR ad takes more delivery, even when each ad’s own CTR stays steady. Meanwhile, an ad receiving under 10% of spend can get called a loser before it has enough delivery to support that judgment.
Low delivery is not the same thing as disproven creative. Nor does a falling ad-set average establish that every ad inside it is deteriorating.
Ask Claude:
For each ad in this ad set over the last 28 days, show weekly spend share, impressions, frequency, outbound CTR and CPA. Which changed: performance within individual ads, allocation between ads, or both? Flag ads with too little delivery for a confident conclusion.
The allocation explanation weakens when every ad’s CTR slides while spend shares remain stable. It gets stronger when shares move but individual response rates hold.
If the issue is an under-tested concept, propose a controlled comparison rather than a rewrite. Use Meta’s A/B test or a separate ad set with its own budget, with a written pass mark. Pausing the winner just to force spend is an informal shortcut, not a clean answer to whether the neglected ad works.
I want Claude to distinguish “this ad declined” from “this ad barely ran.” Those are different briefs.
6. Rule out the page and tracking before blaming the picture
Clicks tell you something about the creative’s ability to earn a visit. Purchases also depend on what happens afterward. When outbound CTR holds steady and recorded purchases fall, I investigate the post-click path before assuming the picture stopped working.
That pattern does not prove the ad is innocent. It does make a landing-page, offer or tracking problem a competing explanation that deserves evidence.
Steady clicks and falling purchases are a reason to inspect downstream, not automatically rewrite upstream. A tracking break can leave clicks looking normal while recorded conversions fall sharply. A page or offer change can leave CTR flat while conversion rate slides. The charts alone do not establish which happened.
Ask:
For this ad over the last 28 days, show weekly outbound CTR, landing-page views, purchases and click-to-purchase conversion rate. List available campaign edits relevant to learning. Ask me for evidence of offer, page or tracking changes instead of assuming access to them. Rank the competing explanations and identify the missing evidence.
This explanation weakens if CTR and conversion rate fall together under stable delivery and there is no supporting evidence of a downstream change. Even then, a simultaneous decline is a clue, not permission to skip the other checks.
The first concrete step is to line up the performance change with the change history you actually have. If clicks hold and purchases do not, check measurement and the post-click path before buying another batch of UGC. New creative pasted onto a broken checkout just spends faster.
7. Make Claude earn the fatigue label before proposing replacements
Fatigue means the same people respond less to the same creative under comparable conditions. That is a narrow claim. “CPA went up” is not a substitute for it.
I want corroboration: rising frequency alongside falling CTR, with conversion rate adding context, after lag, auction costs and delivery shifts have been examined. The working thresholds some practitioners use include frequency above 3.0 in seven days alongside a CTR decline of 25% or more week over week and rising CPC. Treat those as investigation triggers, not a machine that stamps fatigued on an ad.
The useful output is a ranked diagnosis, not a red badge. Ask Claude:
For the remaining suspect ads, show four-week frequency, reach, CPM, outbound CTR and post-click conversion rate. Assess whether delivery is comparable. Rank fatigue against the alternative explanations, cite the account numbers behind each rank, state uncertainty, and say what evidence would weaken your conclusion. Make no changes.
If only CPA moves and the response metrics hold, Claude has not earned the label. If frequency climbs while response deteriorates under stable conditions, the case becomes stronger. Stronger is useful. Pretending it is certain is not.
I would require one short diagnosis table with these fields:
- Evidence used: dates, attribution settings and mature comparison windows, so the view can be pulled again.
- Competing explanations: what supports each one and what argues against it.
- Uncertainty: plain language about missing data or weak support, not a decorative confidence score.
- Next action and pass mark: what to hold, investigate or test, and what result would change the decision.
- Approval gate: no live changes until the proposed action is approved.
Once an ad earns the label, turn the diagnosis into a brief, not a funeral:
Draft three replacement concepts from our offer, landing-page angle and available competitor-ad evidence, without copying competitors’ copy. For each, give the hook, visual change, first three seconds and why it differs from the tired ad. Propose a bounded test with budget, duration, pass mark and approval step. Flag missing inputs and make no live changes.
Approve the test yourself. Keep the old ad running as the comparison where budget allows, and log live changes so the next review has something better than memory to work with. The chat-window fatigue tutorial walks through the workflow with Claude reading live account numbers through groas.
You can run the first six checks manually in Ads Manager for free. Export the breakdowns, compare mature windows and separate changes in response from changes in delivery. I think it is worth doing once so the mechanism is familiar, even if the spreadsheet is not how you want to spend the afternoon.
With groas plugged into Claude over MCP, Claude can read the account and work through that evidence in the conversation. groas Unlimited is $19 a month, flat for the team, not a percentage of spend. The investigation does not get more expensive because the ad budget grows. The same reasoning underpins why frequency alone cannot prove fatigue and the nine checks to run before paying for a fatigue tool.
If I had 20 minutes and one declining ad set, I would still start with item 1. Mature the windows first, because every explanation after it depends on comparing numbers that have had a fair chance to settle. Force Claude to show competing explanations before proposing replacements. Otherwise, the fatigue alert is just an expensive instruction to make more ads.


