

 LinkedIn
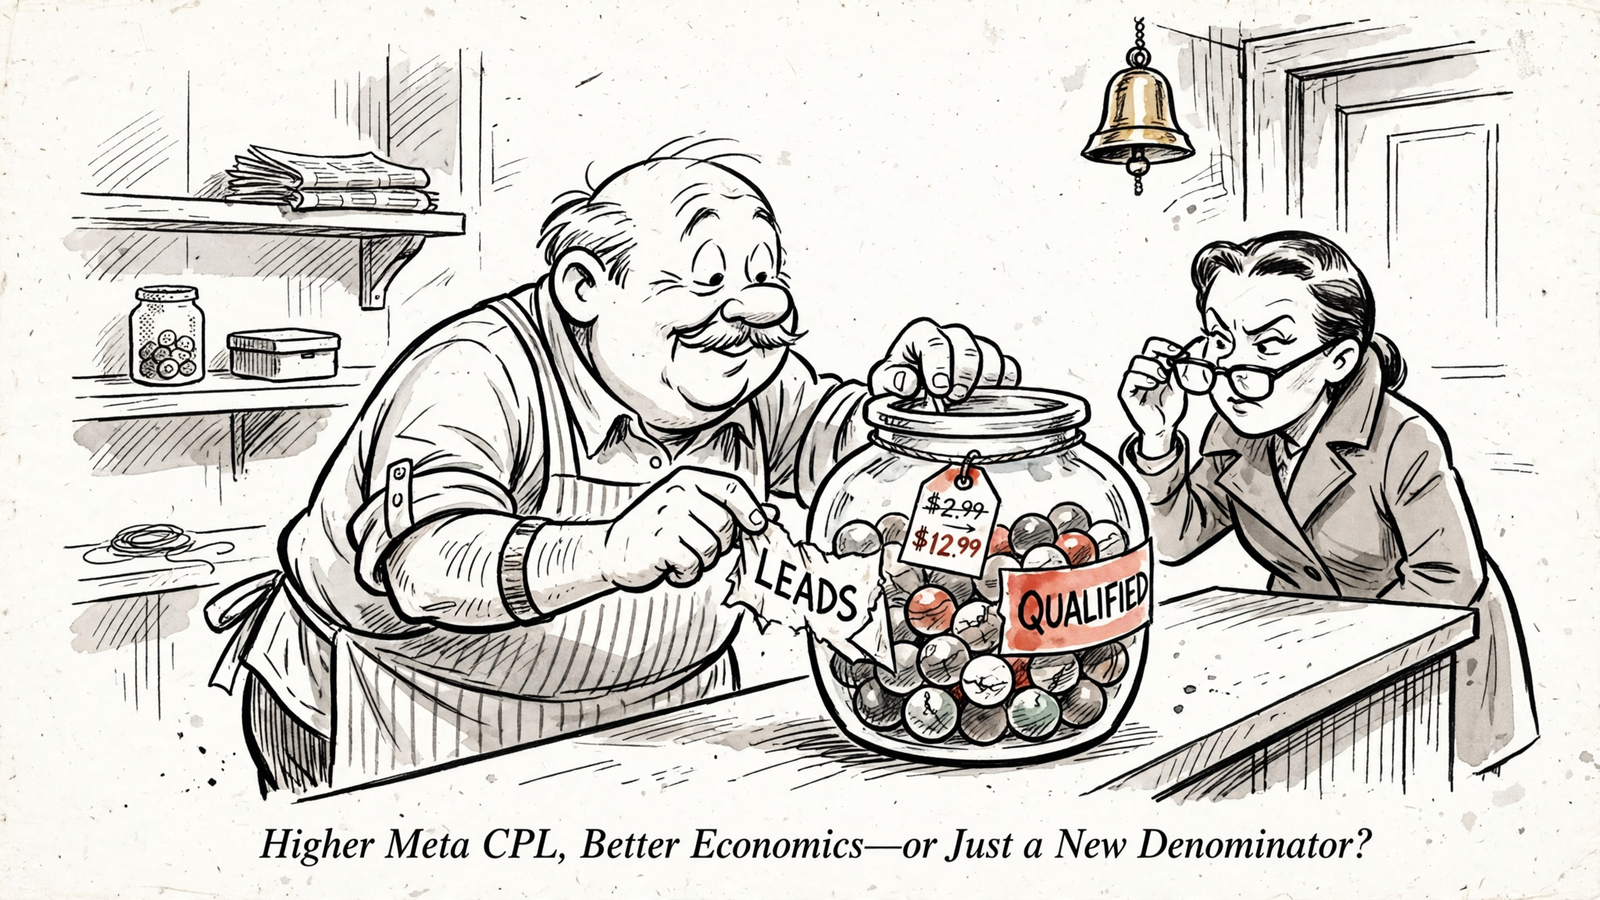
Headline CPL rises by a third while cost per qualified opportunity falls by half. That is the contrast in a published Meta lead-form example, and it exposes the problem with judging qualification by the cheapest name in the CRM.
But there are two very different stories hiding inside that result. A filter can genuinely improve the mix of prospects. Or a report can simply start counting qualified prospects where it previously counted everyone. A more expensive lead is not automatically a worse acquisition. A renamed lead is not automatically an improvement.
I want those stories separated before anyone changes a budget. That means keeping raw leads, bookings, qualified opportunities, and customers in different columns, then pricing the sales work between them. Otherwise, the before-and-after chart measures a change in vocabulary rather than a change in performance.
An expensive booking does not explain why the funnel failed
The complaint behind this analysis comes from an agency owner selling agency services through Meta: roughly $100 per booked call, CPMs above $250, and mostly poor-fit prospects. Those are reported account figures, not a benchmark or a controlled test.
They describe an expensive problem. They do not establish its cause.
A Meta CPM benchmark roundup puts typical CPMs in the $8–$20 range. That comparison makes the reported auction look expensive, but it does not tell me whether the account needs a different audience, a different offer, or a stricter booking process. Broad benchmarks cannot diagnose one narrow agency-acquisition funnel.
The proposed fix is familiar: add budget questions, ask about timing, or show minimum pricing before someone books. Each makes it harder for an unsuitable prospect to reach the calendar. Each can also make the dashboard look worse by reducing the number of events it counts.
Qualification changes who gets through. Reporting must show whether that change helps the business. I would not call the filter a success just because the remaining calls feel better, or a failure just because booked-call cost rises.
Keep the funnel stages separate before comparing costs
CPL is spend divided by leads. Useful arithmetic, provided “lead” means the same thing on both sides of the comparison. As this guide to comparable CPL calculations explains, the definition must stay fixed, and a definition change calls for a fresh calculation.
I keep these stages separate:
- Inquiries: raw form submissions.
- Unique bookings: deduplicated calendar bookings, one per person.
- Held calls: conversations that actually happened.
- Qualified opportunities: prospects who pass the agreed sales bar.
- Customers: people or businesses that sign.
A booking is not a held call. A held call is not a qualified opportunity. Collapsing them into one “leads” column makes a tidy report and a poor decision tool.
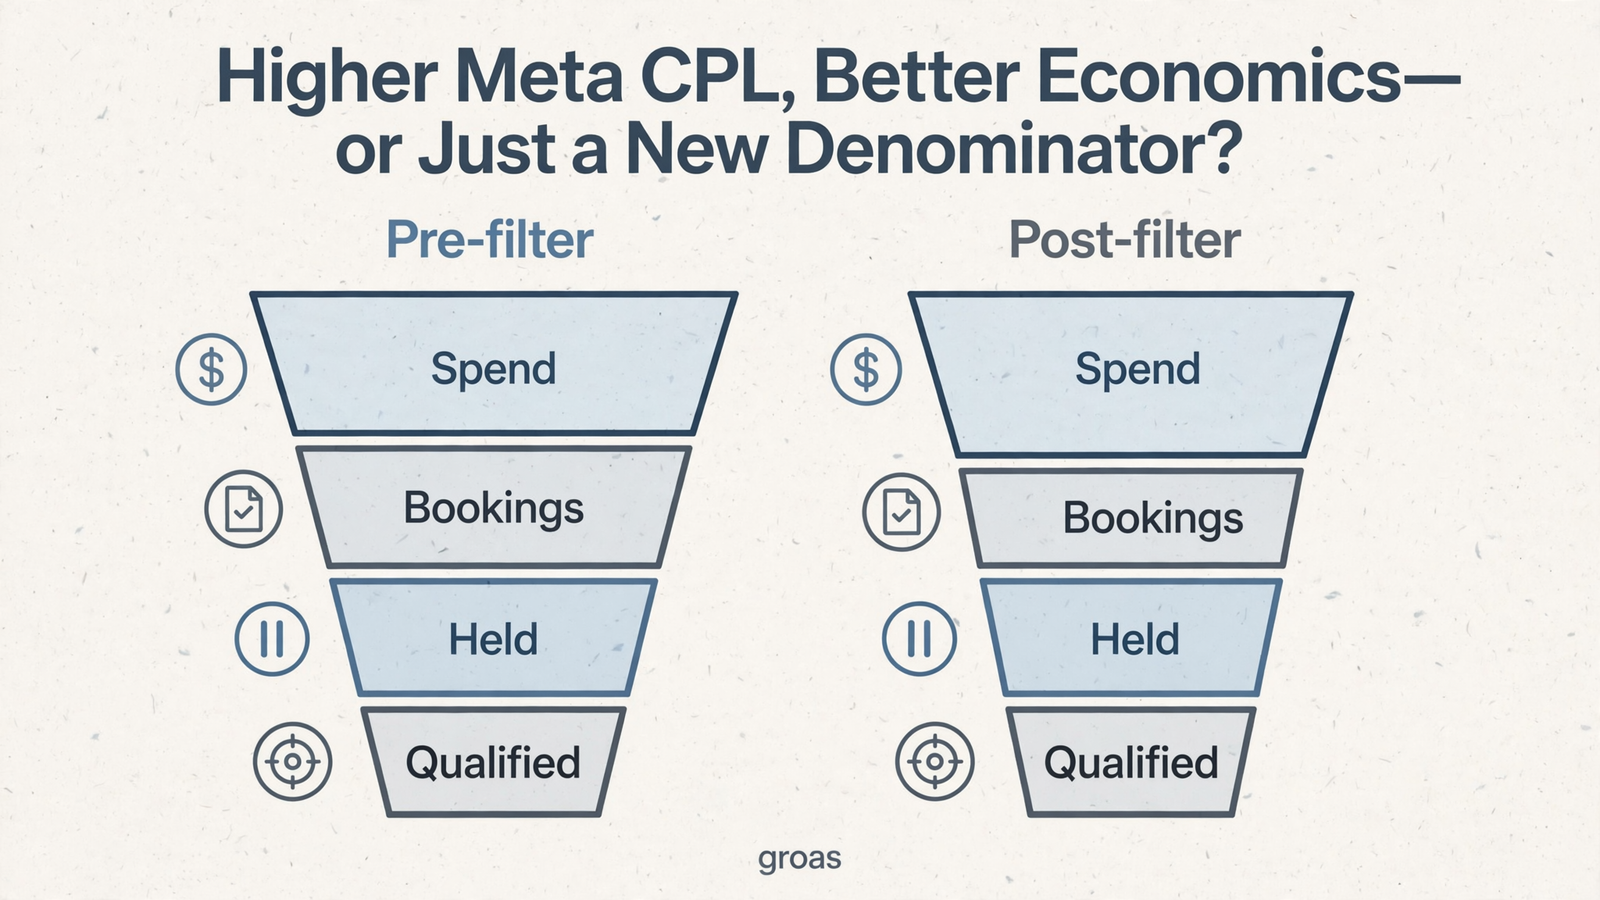
If the old report counts every booking and the new report counts only qualified bookings, the headline cost rises even when the underlying prospects and spend stay identical. That is denominator drift: the label stays familiar while the event underneath it changes.
Recalculate both periods at the same funnel stage. If that is impossible, mark the comparison as broken rather than drawing a confident trend line through it.
Deduplicate people and preserve their acquisition cohort
Repeat bookings flatter the report and punish sales. The same founder books again after a no-show, the calendar records another event, and the closer prepares for the same prospect twice.
I deduplicate by email and phone before calculating unique-booking cost. Then I group prospects by when their inquiry arrived, not when the call happened or the deal closed. Otherwise, a late close can make a newer campaign look productive even though it never acquired that customer.
Keep the sales activity, but do not confuse another appointment with another prospect. Count people once; record the work they create separately.
Example one: higher raw CPL, lower qualified-opportunity cost
The published More Volume versus Higher Intent example uses the same $4,000 spend in each case. More Volume produces 200 raw leads, of whom 30 qualify. Higher Intent produces 150 raw leads, of whom 60 qualify.
The table below restates that example. It is not my client result, and the published figures do not establish a controlled causal test. Crucially, these are raw leads, not recorded bookings. Relabeling them as bookings would introduce the very measurement problem this article is meant to catch.
| Metric | More Volume | Higher Intent |
|---|---|---|
| Spend | $4,000 | $4,000 |
| Raw leads | 200 | 150 |
| Cost per raw lead | $20.00 | $26.67 |
| Qualified opportunities | 30 | 60 |
| Cost per qualified opportunity | $133.33 | $66.67 |
The qualification step screens out more unsuitable volume, while the example records more prospects who pass the sales bar. The result: raw CPL rises by roughly a third, but qualified-opportunity cost halves.
That is not merely a smaller denominator wearing a better label. Assuming “qualified” means the same thing in both columns, the qualified count increases on identical spend. It is a genuine improvement at that funnel stage.
It still does not prove that customer acquisition improves. The example stops at qualification. It does not show whether those opportunities close, what they contribute, or how much sales work they require.
A separate instant-form versus landing-page comparison reports roughly 28% qualified leads from instant forms versus 58% through a landing page. That illustrates why raw CPL can mislead, but it is not a forecast for another account. Different conversion paths are not interchangeable controls.
Judge qualification on a fixed qualification definition, then follow the cohort through to customers. A better middle-of-funnel number is evidence worth investigating, not permission to stop measuring.
Example two: fewer calls, fewer hours, but no guaranteed acquisition win
Now use a constructed example to separate sales efficiency from acquisition performance. These figures are illustrative assumptions, not a client readout or an external benchmark.
Hold spend at $5,000. Before the filter, the funnel produces 50 unique bookings at $100 each. Of those, 30 become held calls, 10 become qualified opportunities, and 2 become customers.
After the filter, the same spend produces 28 unique bookings at $178.57 each. There are 22 held calls, 9 qualified opportunities, and, in this version of the example, the same 2 customers.
The calendar gets quieter. Customer count does not change. But qualified opportunities fall slightly, so their cost does not improve. This is a sales-efficiency case, not a qualified-opportunity-cost win.

Suppose the CRM also records total sales time falling from 38 hours to 23 hours. That includes follow-up, preparation, calls, and notes. The difference is 15 hours; it is not a number I can infer from booking counts alone.
At an illustrative fully loaded cost of $75 per hour, those saved hours have value even though headline booked-call cost rises. This is the work that raw CPL leaves out when it stops at the form submission.
Now change one assumption: the stricter screen costs the business a customer. If each customer contributes $2,500, losing that customer costs more than the assumed sales-time savings.
The filter can therefore make the calendar cleaner and the economics worse. Fewer awkward discovery calls are pleasant. They are not a substitute for contribution.
At equal ad spend, the comparison is:
Keep the filter when sales hours saved × loaded hourly cost exceeds the contribution lost from buyers screened out.
That is the relevant test when acquisition itself has not improved. If spend changes too, include that difference rather than treating the sales saving as the whole result.
Three controls that make the comparison worth reading
Neither example needs a more elaborate dashboard. Both need consistent measurement. I would apply these controls before attributing a result to qualification.
1. Use the same definitions and the same observation window
Freeze the definitions for inquiries, unique bookings, held calls, qualified opportunities, and customers. Then give both cohorts the same time to progress.
A cohort observed for a week and one observed for more than a month are not ready for a close-rate comparison. The younger cohort has had less time to produce customers. That is a calendar difference, not a marketing result.
The conversion-leads requirements described in this breakdown include a target stage reached within 28 days, monthly lead-volume requirements, and daily CRM uploads. Those are conditions for a particular optimization setup, not proof that every business has a mature sales cohort after 28 days.
Use an equal window that lets the outcome you care about develop. Where the customer count is small, show the uncertainty rather than declaring victory from a handful of closes.
2. Separate the qualification change from delivery changes
Adding budget questions while also switching from an instant form to a landing page does not isolate the effect of the questions. Neither does changing the audience or the optimization event during the same comparison.
Keep a change log with:
- The date the form or minimum-price message changes.
- The old and new lead definitions.
- Any audience or conversion-path changes.
- Any change to the optimization event.
- Changes in follow-up speed or process.
A guide to Meta conversion campaigns describes the platform’s learning-volume requirements. A thinner optimization event can complicate delivery, but a subsequent volume dip does not tell me, by itself, whether the filter succeeds or fails.
Likewise, a filter introduced alongside faster follow-up cannot take sole credit for a better close rate. Log what changes before deciding what deserves the credit.
3. Carry the comparison through to contribution and sales effort
Cost per qualified opportunity is a useful checkpoint. It is not the final economic outcome.
I want spend, unique bookings, held rate, qualified rate, customers, contribution, and sales hours beside one another. That is the distinction in groas’s breakdown of falling CPL versus real prospects: the cheaper dashboard event matters only in relation to what happens next.
If qualified-opportunity cost falls but customer contribution falls further, the filter has not earned a victory lap. If that cost rises while contribution holds and sales work drops, it may still earn its place.
Follow the money and the workload, not just the stage with the prettiest percentage.
The table I would request from a Meta management provider
A screenshot showing lower CPL answers very little without its event definition. I would ask for a cohort table from the CRM, with the old and new counting rules visible wherever they differ.
The table below continues the constructed second example. The inquiry figures show how the same intake can be reported under different rules; they do not create additional prospects. Contribution assumes the same $2,500 per customer, and sales hours are illustrative recorded totals.
| Acquisition cohort | Spend | Inquiries: old / new definition | Unique bookings | Held calls | Qualified opportunities | Customers | Contribution | Sales hours |
|---|---|---|---|---|---|---|---|---|
| Pre-filter, mature | $5,000 | 210 / 210 | 50 | 30 | 10 | 2 | $5,000 | 38 |
| Post-filter, mature | $5,000 | 190 / 118 | 28 | 22 | 9 | 2 | $5,000 | 23 |
Read across, not down. The filter holds contribution flat and removes 15 sales hours, despite the higher booked-call cost. That is the improvement this illustration supports. It does not support a claim that qualified-opportunity cost falls.
The old/new inquiry column has a different job: exposing the counting change. Comparing the old pre-filter count directly with the new post-filter count mixes a funnel change with a reporting change. Keep both visible so nobody can pass one off as the other.
For the operating detail, groas’s analysis of lowering Meta cost per qualified lead without buying more dead leads addresses the qualification problem. Its breakdown of the sales follow-up hidden inside B2B Meta lead costs addresses the workload. Both belong in the provider conversation. A polished CPL chart cannot replace either.
If a provider cannot reconcile its reported leads with CRM stages, I would not let that report decide the budget.
Keep the filter only when the economics earn it
Low volume, missing CRM stages, or immature cohorts can leave the answer unresolved. They do not automatically prove that a stricter filter will fail. They mean the evidence is not ready to carry the claim.
Where follow-up is already broken, I would fix speed to lead and persistence before blaming the form. Otherwise, the test mixes prospect quality with what sales does after the inquiry arrives.
Then make the decision on a fixed ruler: compare mature cohorts, hold qualification constant, and price the sales hours. Look for lower qualified-opportunity cost, then check that the gain survives through customers and contribution. If acquisition does not improve, keep the filter only when the saved work outweighs the buyers it screens out.
A higher headline CPL can be worth paying. A changed denominator, by itself, is worth nothing. Keep the filter when the economics improve. If they do not, you are paying more to count fewer names.


