

 LinkedIn

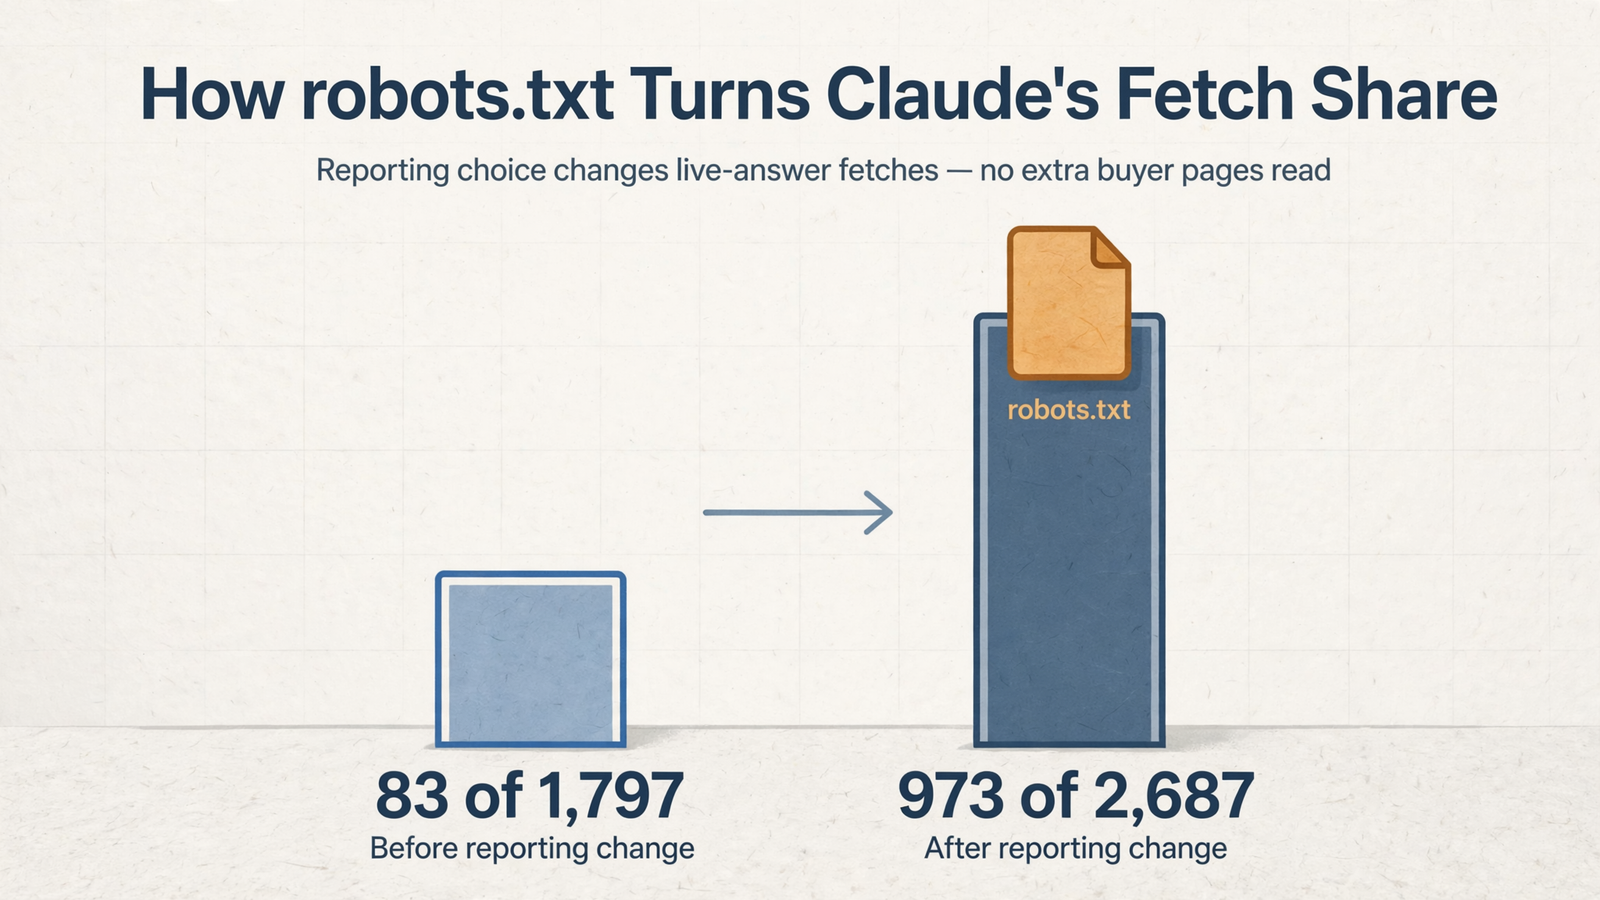
36.2% of the listed live-answer fetches came from Claude—if I count robots.txt. Leave that file out, and Claude’s share falls to 4.6%, without a single buyer-facing page being added or removed.
I checked the arithmetic the way I used to check a CPA claim that looked too clean: hold the sample steady, then isolate what changed. Across four listed HTML pages, ChatGPT accounts for 1,714 fetches and Claude for 83. Add 890 Claude fetches for robots.txt, and Claude’s total becomes 973.
Nothing about the HTML-page activity changes. The report simply starts counting a different kind of resource. That is enough to turn a small Claude slice into something that looks like substantial cross-engine coverage.
Before I pay for that coverage, I want to know what went into the slice.
Start with the four-page sample, not the headline share
I am working from four listed HTML paths, not a full-site crawl: the homepage, one business page, and two update articles. The source for the counts below is the supplied path-level sample. The percentages are calculations over those entries, not independent measurements of the whole site.
The unit is a verified fetch associated with a live answer: a documented retrieval tied to an answer being built. It is not a unique answer, a cited source, or a brand recommendation.
| Listed HTML page | ChatGPT fetches | Claude fetches |
|---|---|---|
| Homepage | 789 | 35 |
| Business page | 41 | 27 |
| Two update articles, combined | 884 | 21 |
| Four-page total | 1,714 | 83 |
On that base, Claude has 83 of 1,797 total fetches: 4.6%. ChatGPT has the remaining 1,714, or 95.4%.
That tells me how the listed HTML retrievals divide between these engines. It does not tell me how often either engine recommends the business. Retrieval puts a page into the working set; citation and recommendation are separate events. The distinction is captured neatly in Retrieved Is Not Cited, and It’s Not Recommended Either.
I keep that distinction beside the table because a label like “AI visibility” can quietly swallow all three events. Once that happens, a retrieval count starts doing a recommendation metric’s job. It is not qualified for the position.
Add robots.txt and the engine mix changes
The supplied entries also include 890 Claude fetches for /robots.txt associated with live answers. Add those to the HTML-page base and the comparison changes immediately.
| Calculation over listed entries | HTML pages only | HTML pages plus robots.txt |
|---|---|---|
| ChatGPT fetches | 1,714 | 1,714 |
| Claude fetches | 83 | 973 |
| Total fetches | 1,797 | 2,687 |
| Claude share | 4.6% | 36.2% |
| ChatGPT share | 95.4% | 63.8% |
These are two calculations over the same supplied sample and window, with a different resource list. They are not before-and-after performance results.
ChatGPT loses no fetches, yet its share falls. Claude retrieves no additional buyer-facing page, yet its share rises. The mechanism comes first: I include a technical file in both Claude’s count and the overall total. The bigger Claude share follows.
Neither calculation is inherently useless. One describes the listed HTML-page activity; the other includes the listed technical-file activity. The mistake is presenting them as interchangeable measures of buyer visibility.
The resource list changes. The evidence of HTML-page retrieval does not. That sentence belongs next to the chart, not buried in its methodology notes.

Technical requests can pile up without equivalent page reading. In a separate new-site example, 101 of ClaudeBot’s first 166 verified requests went to robots.txt and the sitemap index, while 23 went to HTML pages.
That example concerns ClaudeBot, not this live-answer sample. I would not combine the datasets or use it to estimate live-answer behavior. It illustrates the narrower point: a request total can be dominated by technical resources.
The same source distinguishes ClaudeBot, Claude-User, and Claude-SearchBot by their roles and robots.txt tokens. Those distinctions matter before I decide what a “Claude fetch” means. A tall robots.txt bar tells me about checks against a technical file. It does not tell me that Claude read the offer.
Retrieval is evidence of access, not a sale
A fetch does not establish a citation, recommendation, or commercial outcome. Depending on the resource, it records a technical check or a page pulled into the answer-building process. That is useful evidence. It just has limits.
The two update articles account for 905 combined live-answer fetches: 884 from ChatGPT and 21 from Claude. Those entries show retrieval of analytical content. They do not show 905 recommendations, as the related analysis, 905 Live-Answer Fetches Are Not 905 Brand Recommendations, makes clear.
A separate tested workflow reports 32 questions producing 693 cited sources while the brand remained absent unless the prompt named it. That result belongs to that workflow; it is not a conversion rate I can apply to this sample. Its value here is the distinction it exposes: plenty of source activity can coexist with no unprompted brand presence.
That is also why ChatGPT can cite a website and still recommend a competitor. Citation answers where the information came from. Recommendation answers who looks like a fit.
I want those events reported separately:
- Retrieval: the assistant fetched the resource.
- Citation: the answer credited the URL.
- Recommendation: the answer named the brand as a fit.
- Outcome: someone clicked, called, or bought.
Recommendations matter commercially, but they are not revenue either. I do not let the reporting stop one event early and call the job done.
A truncated path list cannot describe the whole market
The supplied path list is truncated. That makes every share here a calculation over listed entries, not a sitewide estimate.
I cannot turn either percentage into “Claude’s share of the site’s AI visibility.” I also cannot infer what Gemini or Perplexity did from their absence in this list. No listed paths means no listed activity to count. It does not prove those engines never touched the site.
This is where the language around a number needs to stay attached to its scope. “Share of listed HTML fetches” is awkward but intelligible. “AI market share” is cleaner and unsupported. I will take awkward.
Even share of model does not have one settled denominator. A breakdown of share-of-model methods distinguishes approaches based on brand mentions, answers mentioning the brand, and blended measures of presence, position, sentiment, and citations.
Those measures answer different questions. None becomes comparable just because a dashboard formats it as a percentage.
For this sample, the useful conclusion is narrow and strong: adding the listed robots.txt activity changes the engine mix dramatically. The data runs out before sitewide visibility, market coverage, or commercial impact. I stop there.
The four lines I want in a cross-engine report
When I assess coverage across engines, I want technical-resource fetches, HTML-page fetches, citations, and recommendations on separate lines. Not four ingredients blended into one score.
| Reporting line | What it establishes | What it does not establish |
|---|---|---|
| Technical-resource fetches | Activity against files such as robots.txt and sitemaps | That an offer or article was read |
| HTML-page fetches | Retrieval of the listed page content | That the answer cited or recommended it |
| Observed citations | A URL was credited in an answer | That the brand was recommended |
| Brand recommendations | The brand appeared as a fit in the observed answer | That a click, call, or sale followed |
Each line needs the engine or product, measurement window, and scope beside it. For observed answers, I also want the prompt text. A fetch log and a prompt test are different evidence; the report should say which one produced the number.
I would split HTML pages further by role rather than calling every page a buyer page. This sample contains a homepage, a business page, and analytical updates. Their retrieval counts can sit together in an HTML total without pretending they all perform the same commercial job.
Platform boundaries matter too. ChatGPT Search, Google AI Overviews and AI Mode, Gemini, Bing and Copilot, Claude, and Perplexity should not disappear into an unexplained aggregate. The share-of-model methodology discussion makes the case for disclosing aggregation rules and retaining platform-level results.
My practical test is simple: can I find the robots.txt count without opening a methodology appendix? If not, the headline chart is doing too much hiding.
Get the definitions in writing before expanding coverage
I used to tell clients a blended share was enough to compare vendors. I was wrong. A percentage is not a common unit when the vendors count different things.
One audit of AI visibility platform methodologies describes conflicting definitions: a help document defines share of voice using impression weighting and Google search volume, while a product FAQ describes the percentage of AI answers mentioning the brand. Those are different calculations, even if the dashboard gives them the same label.
I do not need a longer sales deck to resolve that. I need the counting rule.
Before expanding coverage beyond ChatGPT, I ask for:
- Resource list: the included paths and file types, with robots.txt, sitemaps, and HTML separated.
- Event definition: whether the metric counts fetches, answers, mentions, citations, recommendations, or a disclosed blend.
- Prompt list: the exact prompts used for answer-based measurements, labeled by engine.
- Window and aggregation rule: the dates measured, what gets pooled, and how repeated observations enter the total.
- Work after measurement: which permission or page changed, which prompt was retested, and where the change and its reason were logged.
I also ask for both versions of the headline calculation: HTML only, then HTML plus technical resources. If the conclusion changes, I want to see that before the retainer changes.
This is not paperwork for its own sake. It is how I distinguish more observed activity from more useful coverage—and useful coverage from a chart that got taller.
Keep the permission decision separate from the popularity score
robots.txt belongs in the operational report, not disguised as buyer interest. It helps express permissions for crawlers and fetchers. That is a different job from measuring whether an answer recommends the business.
Training and live-answer retrieval also need separate treatment. The robots.txt guidance for search and AI crawlers distinguishes training agents from search and user-triggered retrieval agents, including differences in how fetchers handle the file.
The practical decision is which activities to permit, not whether a single “AI bots” switch should be on or off. Blocking a training agent and allowing a separate live-answer agent are different choices. I want the relevant permissions checked explicitly rather than inferred from a blended traffic count.
For a business seeking discovery through live answers, the useful sequence is:
- Check the relevant crawl and retrieval permissions.
- Measure retrieval of the pages that matter.
- Inspect citations and recommendations in the observed answers.
- Retest after a permission or page change.
The robots.txt requests help with the permission question. They cannot answer the other questions by accumulating faster.
Keep those requests where they belong: evidence that the checker knocked, not evidence that Claude read the offer. Then judge the work after the knock. Which permission changed? Which page was fixed? Which prompt was retested? What moved in the observed answers?
That is the log I want to pay for.
The decision: buy comparable definitions before broader coverage
Say I am adding AI search to an existing SEO retainer. I ask the agency to show the calculations side by side: 83 of 1,797 for the listed HTML pages; 973 of 2,687 after adding robots.txt. Same supplied sample. Same window. Different resource rule.
If the vendor will not disclose that rule, I cannot compare its headline number with another vendor’s. I walk away from the blended chart at that point. No page was fixed, no prompt was retested, and no recommendation was earned by changing this count. Only the report changed.
That is also why I want measurement followed by accountable action. With groas connected to ChatGPT or Claude, I can keep autopilot off until I choose to switch it on. Changes are logged with their reasons and can be undone in one step. That is the operational standard I care about: a visible change, a reason beside it, and a way back when the fix is wrong.
The reporting still has to earn my trust. Neither a tool nor an agency gets to substitute technical-file activity for evidence that a buyer-facing page was retrieved or a brand was recommended.
Start with the 4.6% and 36.2% pair and the buying decision gets plain: pay for clearly defined measurement and work that can be checked. Coverage without comparable definitions is decoration, and decoration never moved CPA.


