

 LinkedIn

Delete the reports that only answer one question
Delete most of your Looker Studio reports. I built enough of them to recognize the ritual: open a report, find one number, close it before the next meeting starts.
Nobody sits there watching a line chart move. They want to know why CPA went up, where the money went, or what to tell the client on Monday. We built twelve pages to make them hunt for one answer.
I would rather ask that question of ChatGPT or Claude connected through groas to Google Ads, Meta, Search Console and GA4. Start with the numbers, ask what changed, then follow the evidence toward a fix. The dashboard mostly tells me whether something moved. A conversation lets me investigate why and decide what to do next.
That is the trade most teams should take. Keep one dashboard for shared monitoring. Stop maintaining the rest out of habit.
Five questions are doing all the work
When I managed accounts by hand, I built Looker Studio reports the way clients asked for them. A page for Google Ads. A page for organic. A blended page for the Monday meeting. After the first month, the pattern was always the same: someone opened the report to answer one question, then left.
Those questions were usually:
- How did spend, conversions and CPA change week over week, by channel?
- Where did we waste money this week: which campaigns, search terms or ads?
- Which landing pages lost organic clicks, and did paid traffic to those pages change?
- Which channel, campaign or page actually drove the revenue move?
- What do I tell the client on Monday, in plain English?
A recurring question does not automatically need a permanent dashboard. It needs a reliable way to get an answer.
Marketing dashboards do two different jobs: monitoring the same governed numbers on a schedule, and answering a one-off why question. Assistants fit the second job. A fixed dashboard serves the first. Most reports I maintained were being used for investigation while we paid to maintain them as permanent infrastructure.
The cost is not just the licence. For 30 clients running Google Ads, GA4, Meta and Search Console, the reporting stack alone can run $200 to $500 a month before labour. Then come the hours spent building pages, fixing fields and reconnecting sources.
Paying for reporting is not the problem. Paying to preserve an elaborate route to five questions is.
Replace the report with the question behind it
I used to tell clients a dashboard would save them time. I was wrong about which part took the time.
The build was the easy week. The tax came later: the Monday re-authentication failure, the blended source with mismatched campaign fields, the report that loaded like wet concrete because it pulled five live sources. None of that work improved an ad or fixed a landing page. It kept the reporting machinery alive.
I was maintaining tiles when the client needed an answer.
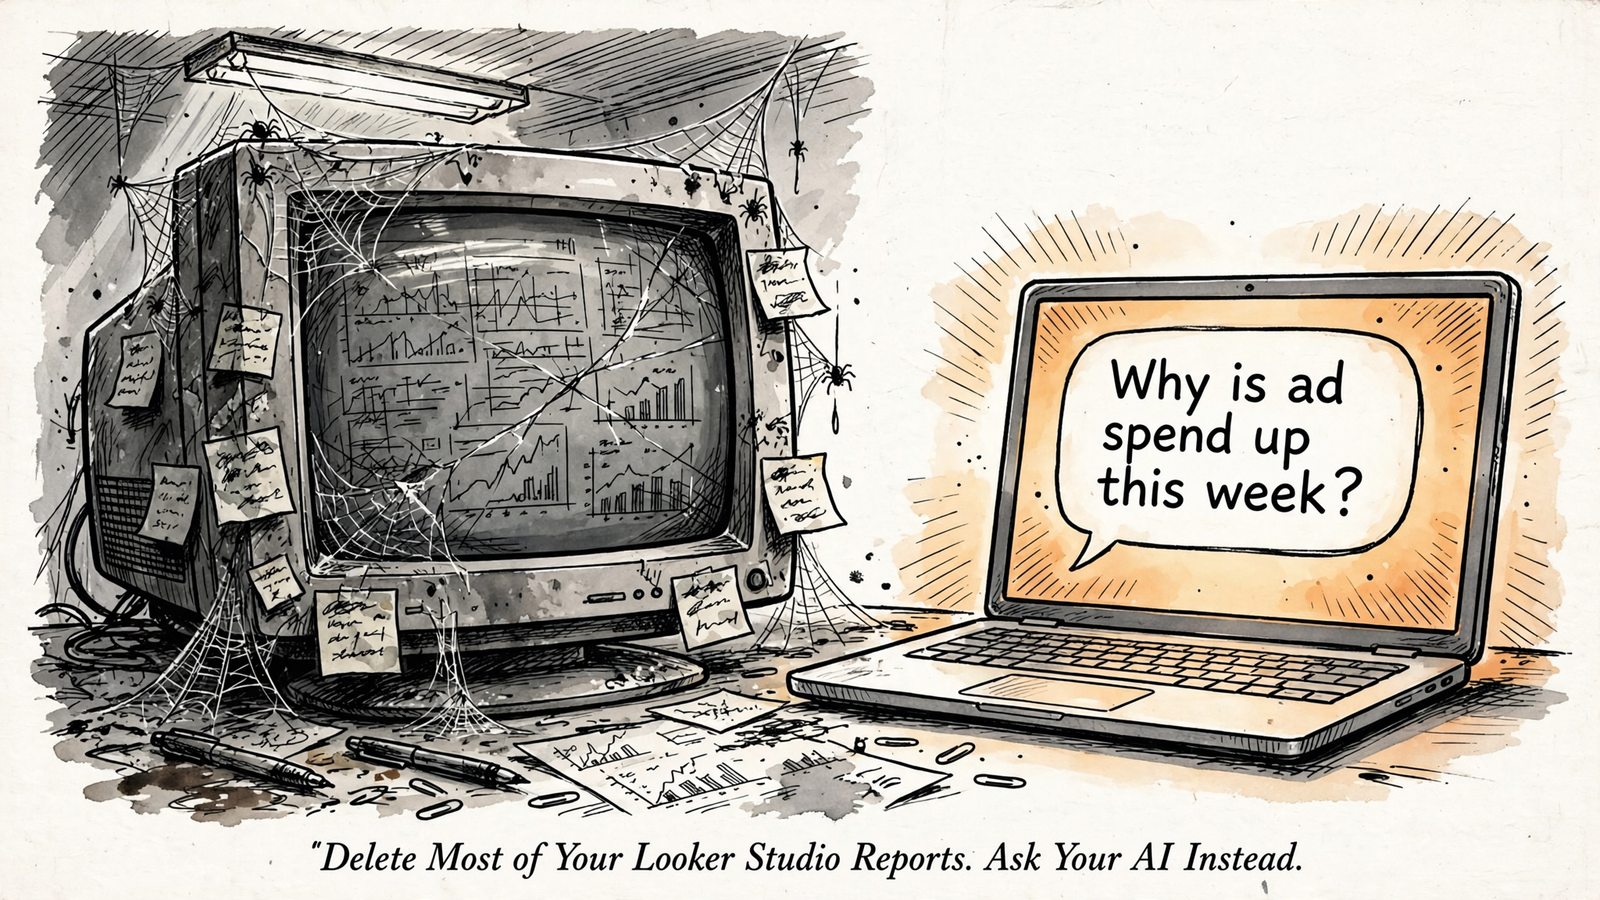
Through groas, those five questions become prompts I can use in ChatGPT or Claude against connected data. Start with the Search Console and GA4 connection walkthrough, then replace the reporting ritual with questions like these:
- Check performance:
Through groas, how did spend, conversions and CPA change week over week across Google Ads and Meta? Break it down by campaign and flag anything that moved more than 15%. - Find spending to investigate:
Through groas, where might we have wasted money in the last 14 days? List search terms and placements with spend and no conversions. - Connect organic and paid:
Through groas, which landing pages lost organic clicks in Search Console this month, and did paid traffic to those pages change in GA4? - Investigate revenue:
Through groas, break down the revenue change by channel, campaign and landing page. Name the source and attribution definition for each comparison. - Prepare the client update:
Write the weekly client summary from live numbers: three bullets per channel, then one line on what we do next.
The useful part is not the first response. It is the follow-up. Which campaigns account for the CPA increase? Did conversion volume fall, or did clicks get more expensive? Did traffic to the affected landing page change?
A tile gives me the comparison I designed in advance. A conversation lets me pursue the next question without rebuilding the report. That is where the time goes back into account management instead of report management.
Connect the answer to the work
Here is the mechanism. groas plugs into ChatGPT, Claude or another agent over MCP at mcp.groas.ai/mcp. I connect the ad accounts and website once, then use plain English to read numbers and, when authorized, make changes.
The connection covers Google Ads, Meta, Search Console and GA4, alongside Bing, ChatGPT Ads, SEO and AI search visibility. groas also collects competitor ads and funnels, Reddit research, and Semrush and Ahrefs data around the clock. That gives the conversation more to work with than the metrics in a reporting connector.
groas Unlimited costs $19 a month flat for unlimited teammates, ad accounts and websites. For an agency, that means the same subscription across clients, rather than another reporting stack to assemble for each account.
I tried the piecemeal MCP route before groas. I would skip it. Separate installs and authentication flows leave me maintaining connections again, just without the charts. The point of replacing the dashboard is not to acquire a more fashionable maintenance problem.
Through groas, the same chat that investigates spend can pause a losing ad, shift budget or draft replacement copy. I still decide whether the evidence justifies the move. But I do not have to carry the finding from a report into another interface before doing anything about it.
Reading is the starting point. Acting, with a log and an undo, is what makes the replacement useful. Otherwise, I have only traded a dashboard tab for a chat tab.
Separate permission to report from permission to spend
I leave every account I connect read-only until I explicitly allow a change. That is the rule I used as a freelancer, and it is the rule I keep now.
Through groas, the AI starts read-only until I say otherwise, and I can disconnect at any time. Autopilot stays off until I switch it on. When I allow changes, each change is logged with its reason and can be undone in one step.
That distinction matters more than the elegance of the answer. A convincing explanation is not spending permission. Neither is a tidy client summary.
I separate the rollout:
- Reporting access first: let the AI answer questions from the connected accounts.
- Changes second: authorize work campaign by campaign, with a budget cap in plain English.
- Autopilot separately: switch it on deliberately, under rules I set.
The log connects the number to the action: what changed, why it changed and how to reverse it. A report shows the outcome. Account management also needs a record of the decisions behind it.
If the AI cannot show its work and undo a change, it does not touch spend. Faster answers are useful. Faster unreviewed mistakes are not the objective.
Keep the one dashboard that serves a shared purpose
I am not arguing for deleting every dashboard. I am arguing for deleting the ones used as slow question-answering machines.
One kind earns its keep: the monitoring dashboard that people check on the same schedule, using the same definitions. The office wall screen. The executive KPI page that never changes shape. The finance reconciliation where the number must match next month.
That monitoring job needs a shared, governed view and a freshness stamp. Everyone needs to know which number they are discussing and when it was updated. A private chat thread is not a substitute for that shared reference.
Keep that page boring on purpose:
- The same tiles.
- The same date logic.
- The same definitions.
- A named owner.
- A regular check.
Everything else has to justify its maintenance. The twelve-page client pack that exists so someone can screenshot one tile for Slack does not get a lifetime exemption because it took a week to build.
If a report has one reader and one question, it is probably a prompt I have not written yet. Keep the shared reference. Retire the scavenger hunt.
Start this week; delete only after the answers match
This does not need a quarter-long reporting transformation. That is how a smaller maintenance job acquires a steering committee.
I would start the replacement in one week, then validate it alongside the existing reports for two weeks before deleting anything. Starting quickly and deleting blindly are different decisions.
- Inventory the reports. List every Looker Studio report under maintenance and check views for the last 30 days. Anything with fewer than three regular viewers goes on the review list, not straight into the bin. The question is what job it performs.
- Choose the monitoring page. Keep spend, conversions, CPA or ROAS by channel, with consistent date logic. Freeze the definitions so finance and the client can recognize the same number twice.
- Write the replacement questions. Start with the five above. Save the prompts the team actually uses, not an impressive library nobody opens.
- Run both for two weeks. Compare the answers with the old report and the source platforms. Investigate differences before treating either version as correct.
- Delete what no longer has a job. Once the replacement passes, stop maintaining the duplicate pages. No new blend fixes for a report already replaced.
For organic work, I would start with these 15 SEO prompts for Claude or ChatGPT connected to Search Console and GA4, then keep only the ones that answer recurring questions.
The deletion test is simple: does the AI answer the actual question faster, with current numbers and a useful next step? If it does, and the numbers check out, the tiles underneath it no longer earn their maintenance.
Do not preserve duplicate reporting because removing it feels less productive than building it. That instinct is how the dashboard farm got so large.
Check the definitions before acting on the answer
I double-check three things before acting on an AI answer: spend, conversions and the date range behind both.
The platforms do not always describe the same event in the same way. Google Ads and GA4 can assign conversions to different dates. An answer that blends sources without naming them can sound confident while comparing different definitions. Replacing a chart with fluent prose does not repair that problem.
My prompts end with the same instruction:
Show the source, the date range and the exact query behind each number. Keep different attribution definitions separate.
If it cannot show the query, I treat the answer as a draft. If the explanation does not follow from the evidence, I keep investigating. The advantage is being able to ask the follow-up immediately, not being excused from checking the result.
That is the cost of this alternative: I still have to define the question, inspect the numbers and approve the work. What disappears is the obligation to build a permanent reporting surface for every question I might ask.
Keep feeding a dashboard farm and both taxes remain: the connector bill and the maintenance work every time a field changes. Keep one governed page for shared numbers. Move the rest to questions asked of live data, checked against the source, with the next action in the same conversation.
Ignore that distinction and next year will look familiar: another broken blend, another rebuilt tile, another meeting spent finding the number while someone else has already asked, answered and acted.


