LinkedIn

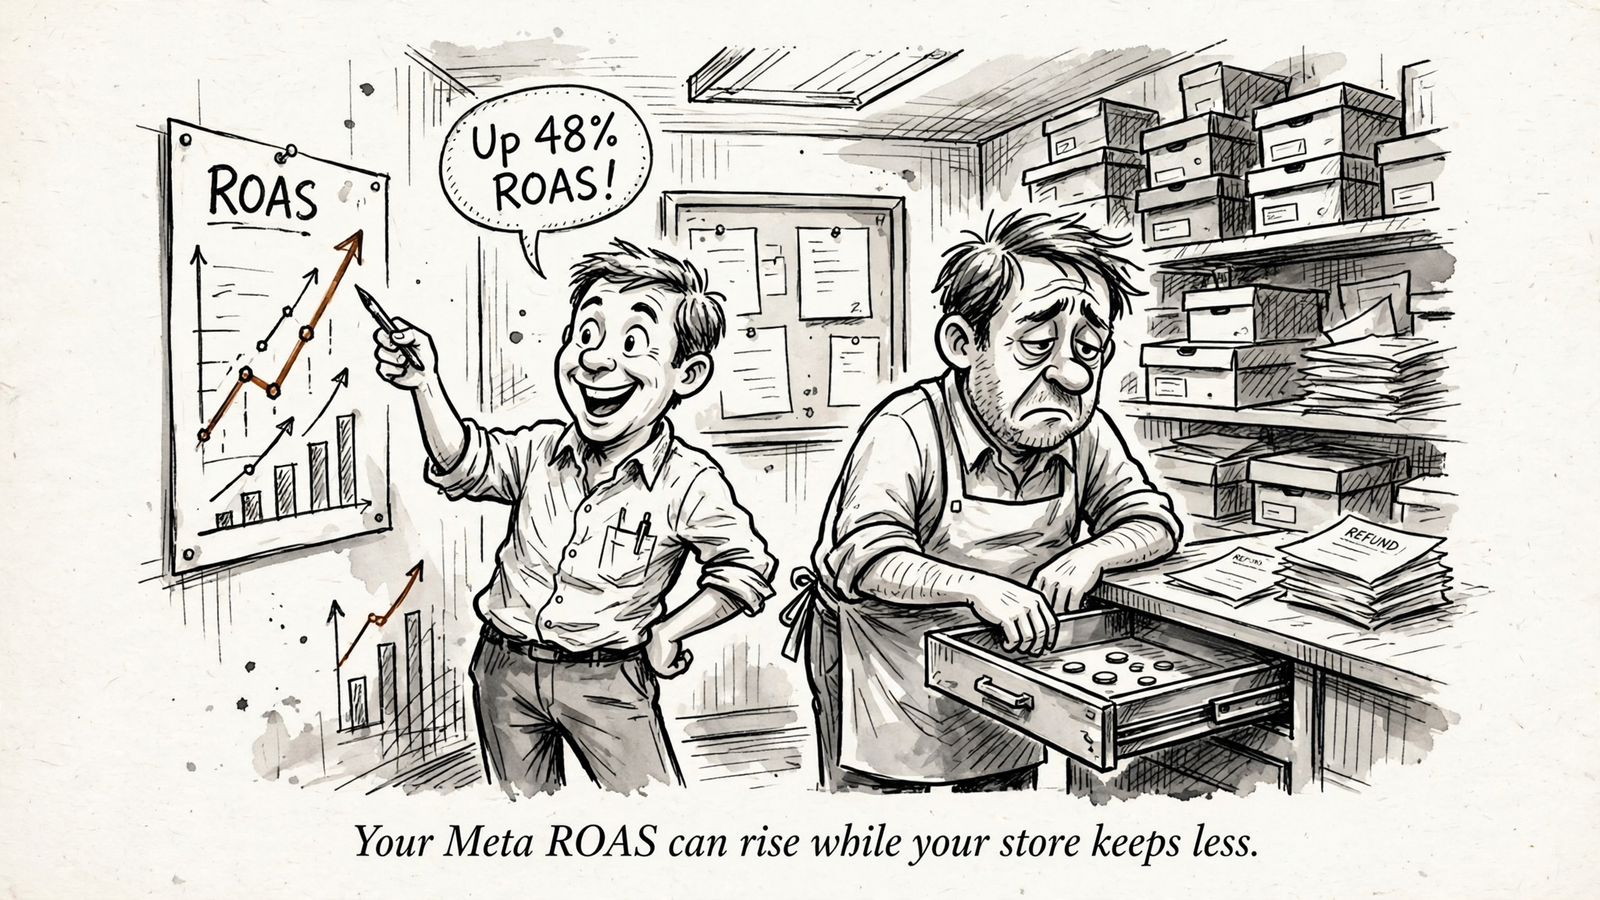
A 5x Meta ROAS can leave your store with less money than a 3x return. The report improves because it measures attributed revenue, not the profit your advertising created.
Say you spend $20k a month and ROAS climbs from 3.2x to 4.8x. The slides look cleaner each month. Finance keeps asking why the bank balance does not agree.
Free tool: the ROAS Calculator works out your return on ad spend, your break-even ROAS and the budget a revenue goal takes.
Everything in that disconnect follows from one fact: platform ROAS is attributed revenue divided by ad spend, nothing more. It counts revenue over spend, not profit. It does not subtract product costs, shipping or refunds. It does not tell you what a discount did to your margin. And it does not prove the ad created the order.
I start there because the rest is arithmetic, not an attribution argument nobody wins.
Start with what ROAS actually counts
The formula has two inputs:
Platform ROAS = attributed revenue ÷ ad spend
The top number is the revenue Meta credits to ads under the account’s attribution settings. Under a 7-day click plus 1-day view window, a click followed by a purchase within seven days can count. See an ad without clicking and buy the next day, and that can count too. The bottom number is what you paid Meta.
Nothing in that division subtracts product cost, payment fees, shipping, support time or refunds. I used to tell clients ROAS was a profit proxy if we squinted. I was wrong.
What remains after variable costs is contribution margin. For the calculations below, I use contribution before ad spend, then subtract the advertising bill separately. Otherwise, it is easy to subtract the same expense twice.
ROAS tells you how much revenue the platform claims per advertising dollar. Contribution tells you what is left from that revenue. Keep those separate before judging whether a campaign worked.
Attribution answers “who gets credit,” not “what caused the sale”
There is a second distinction inside that top number. An attributed order is not necessarily an additional order.
A customer can see a Meta ad, click an email and return through branded search before buying. Several reports may claim credit for the same purchase. One breakdown describes platform claims running 20–40% above what the store actually banked. The order happened once. The reporting systems are less restrained.
I keep platform ROAS for diagnostics, then check blended ROAS: total store revenue divided by total ad spend. Because it starts with store revenue rather than adding up platform claims, it does not count that order repeatedly.
That gives us two separate questions:
- Economics: How much contribution did the attributed orders leave?
- Causality: How many of those orders happened because of the ads?
A better ROAS answers neither on its own.
Check who bought before celebrating the ratio
Returning buyers know the product and need less convincing. That can make them cheaper to convert than new customers, lifting the account average without an equivalent improvement in acquisition.
In one published breakdown of a scaling month, existing customers took only 10% of spend but produced 23% of revenue, at about $20 per purchase against $70 for new buyers. That mix makes the ROAS report look good. It does not tell us how many returning buyers needed the ad to purchase.
When I audit an account where ROAS suddenly improves, this is the first split I request. If the campaign’s job is prospecting, a growing share of delivery to existing customers deserves an explanation. Some leakage is normal because exclusions miss privacy opt-outs and unmatchable users. But a campaign can also drift toward the people easiest to convert rather than the people it was meant to acquire.
A shift toward returning customers can improve reported efficiency without improving new-customer growth. It is a reason to investigate, not proof that every repeat purchase would have happened anyway.
Ask for the new-versus-returning split before celebrating the ratio.
Check what each order leaves behind
Customer mix is only one way the average changes. Product mix and discounts can do the same thing.
Two campaigns can both report 2.5x ROAS and leave very different amounts after supplier, fulfillment and refund costs. That is why calling 3x “good” without knowing margin tells you very little.
A shift toward discounted bundles or lower-margin products can raise revenue while reducing contribution. Order count spikes, the report holds up, and the owner feels rich until the freight bill arrives.
Take the simple promotion example: a $60 item sold at 20% off brings in $48. The selling price falls. The product and fulfillment costs do not automatically fall with it. The discount has to come from somewhere.
Before judging the campaign, reconcile:
- Selling price: What did the customer actually pay after discounts?
- Product and fulfillment costs: What did those orders cost to supply and deliver?
- Refunds and cancellations: How much revenue did the store retain?
Use historical net revenue after refunds without subtracting those refunds again. Clean inputs matter more than another decimal place in the dashboard.
A revenue target without a margin assumption is an incomplete target. The next calculation shows how incomplete.
Work the numbers: 5x can leave less than 3x
Keep ad spend fixed at $1,000 so the economics are easy to compare. This is hypothetical arithmetic, not a result from a store.
| Case A: higher ROAS | Case B: lower ROAS | |
|---|---|---|
| Ad spend | $1,000 | $1,000 |
| Attributed revenue | $5,000 | $3,000 |
| Platform ROAS | 5.0x | 3.0x |
| Contribution margin before ads | 20% | 50% |
| Contribution before ads | $1,000 | $1,500 |
| Contribution after ads | $0 | $500 |
Case A produces $5,000 × 0.20 = $1,000 in contribution. Subtract $1,000 in ads and nothing remains.
Case B produces $3,000 × 0.50 = $1,500. Subtract the same advertising bill and $500 remains.
Same spend. Lower ROAS. $500 more contribution after advertising. That is not the same as final business profit, but it is a better basis for this decision than the revenue ratio alone.
The rule behind the table is break-even ROAS = 1 ÷ contribution margin:
- At a 20% margin, break-even ROAS is 5.0x.
- At a 50% margin, break-even ROAS is 2.0x.
Judge the report against the margin, not against 4x folklore.

Neither case proves the ads caused the orders. These calculations assume comparable revenue definitions, attribution windows and cost treatment, with no refund lag muddying the comparison.
Even if Case B leaves $500 on paper, some of its orders might have arrived through search, email or a direct visit anyway. The margin calculation establishes the economics of the attributed orders. It does not establish the economics of the sales caused by advertising. That needs a different check.
Reconcile the reports before arguing about performance
Align the window, revenue definition and customer labels
Meta and finance can disagree because they are measuring different things over different periods.
Under 7-day click and 1-day view attribution, a Monday click followed by a Sunday order can qualify for Meta credit, even if the customer returns through branded search on Saturday. Add refunds posted two weeks later, preorders shipping next month and customer records that misclassify repeat buyers, and the reports stop lining up.
I check three things before treating that gap as a performance problem:
- Attribution window: Which window does the account report on?
- Revenue definition: Is revenue gross or net of refunds and cancellations?
- Customer classification: What makes someone new rather than returning?
Those checks will not make attribution causal. They will stop the monthly call becoming an argument between incompatible numbers.
Use blended ROAS as a warning light, not a verdict
I check blended results before getting absorbed in Ads Manager. Take total store revenue for the same period and divide it by total ad spend across channels. This blended ROAS, also called MER, gives the platform report some business context.
If Meta reports 4.8x while blended stays at 2.1x, I want to know why. If platform ROAS improves while blended does not, the platform’s apparent gain is not showing up as better store-wide revenue efficiency.
That is a warning, not proof that the ads created nothing. Blended ROAS cannot tell you which sales advertising caused. It also cannot explain a margin change on its own.
To separate observed sales from caused sales, compare an exposed group with a holdout that does not see the ads. Scale the groups to equal size, subtract control revenue from treatment revenue, then divide that extra revenue by spend. That is incremental ROAS.
Use blended results to spot the question. Use a holdout, where feasible, to test the causal claim.
Give the management team inputs it can act on
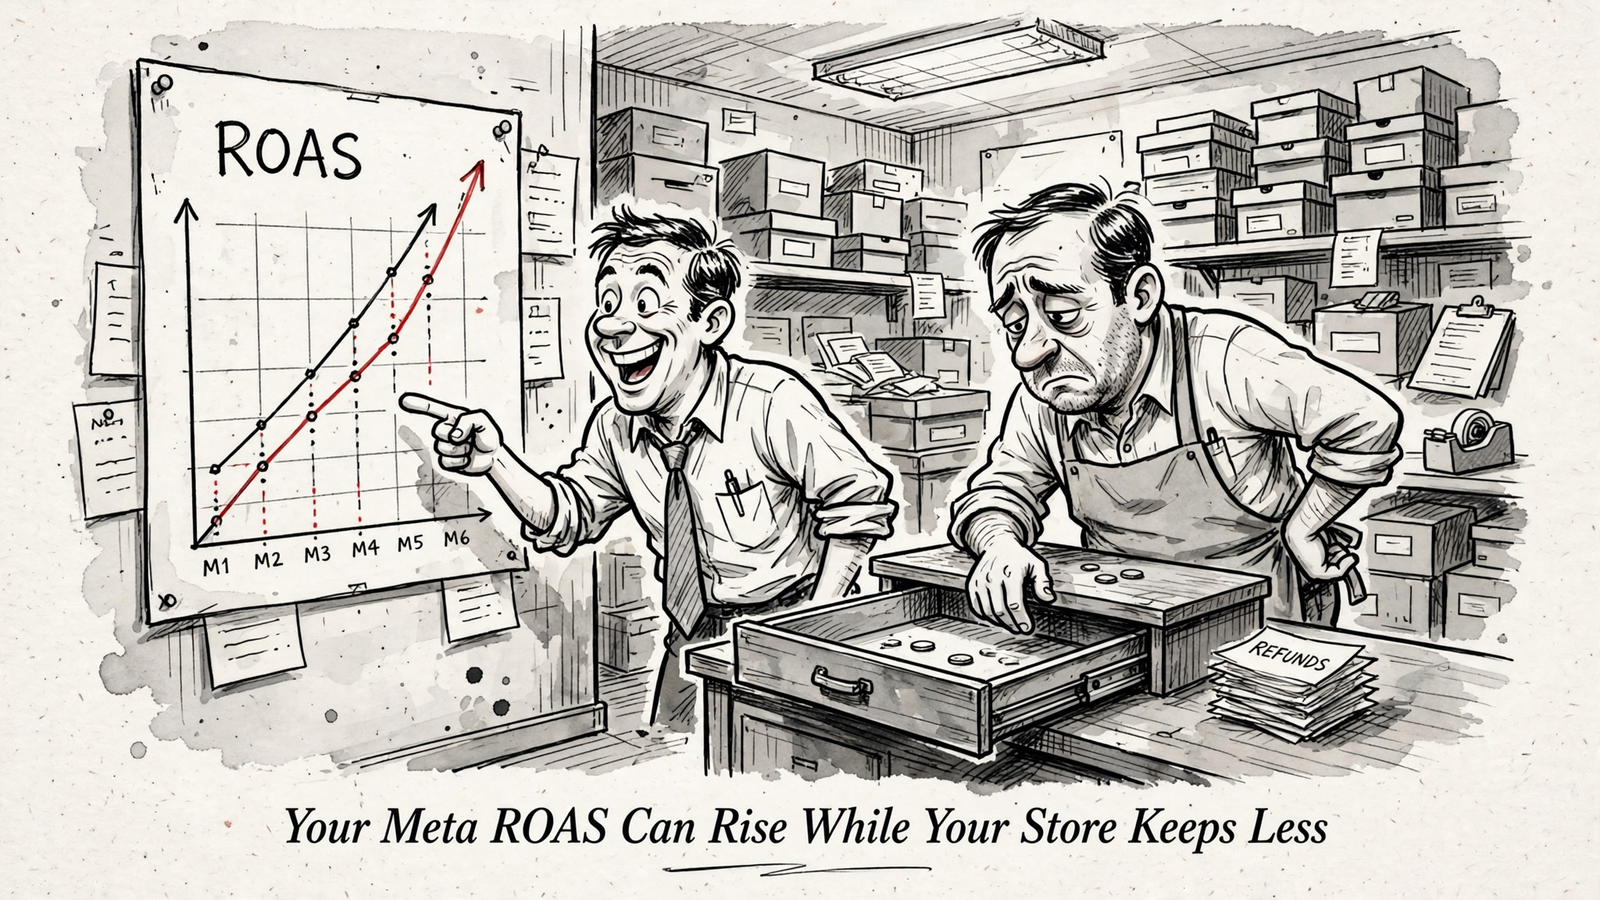
I have sat through the monthly call where the manager points at a rising chart and the owner points at a flat contribution line. Both can be reading true numbers.
The first fix is not a new audience or a new hook. No bidding system can optimize toward a margin it never sees. Give the team:
- Margin ranges by product group.
- A consistent definition of new versus returning customers.
- Order data reconciled net of cancellations and refunds.
If your reporting glossary for stores with returns and preorders calls it retained revenue, use that definition consistently. Do not let the same label mean one thing in the deck and another in the finance sheet.
Then ask for a weekly view with three layers:
- Platform ROAS for account diagnostics.
- Blended store revenue over total ad spend for business context.
- Contribution after advertising and the new-customer share for the spending decision.
When the manager proposes a target, ask for the break-even calculation. Rebuild the Meta ROAS target from current order economics before changing the ads.
A good management team will welcome that sheet. A team that only wants to be judged on attributed revenue will fight it. That tells you what you hired.
Test the easiest-looking revenue before budgeting around it
Retargeting is where I start questioning incrementality because the audience already has a relationship with the store.
Here is a hypothetical worked example:
- Spend $10,000 on retargeting.
- Meta reports $70,000 in attributed revenue: 7.0x ROAS.
- Compare an exposed group with a matched holdout, scaled to equal size.
- Find $15,000 in extra revenue in the exposed group.
- Divide $15,000 by $10,000: 1.5x incremental ROAS.
The incrementality factor is 1.5 ÷ 7.0, or about 0.21. In that test, roughly 21% of reported revenue represents additional revenue caused by the ads.
I would treat that as a working estimate for that setup, not a permanent discount applied to every future report. Re-test before budgeting around an old factor. Demand shifts, lists go stale, and the estimate needs checking again.
The next step is the same margin calculation we already built. Additional revenue still has costs. Incremental ROAS is not incremental profit.
Apply the model to next month’s budget
Now the manager proposes scaling the 5.0x campaign and pausing the 3.0x one. The platform ratio makes that look obvious. I would work through three questions, in order.
- Who bought? Suppose the 5.0x line is 60% returning buyers and the 3.0x line is 80% new buyers. The campaigns are doing different jobs. The higher ratio may reflect easier conversions, not better acquisition. Ask for evidence before calling it growth.
- What did the orders leave? Suppose the 5.0x line runs at 20% contribution before ads after a sitewide discount, while the 3.0x line runs at 50% on full-price orders. The first needs 5.0x just to cover advertising. The second leaves $500 per $1,000 of spend under the assumptions in our table.
- What did the ads cause? Suppose blended revenue does not rise when the 5.0x line scales, and no holdout supports the incremental-sales claim. That does not prove the campaign creates nothing. It does mean the case for scaling remains unproven. The dashboard cannot settle it.
I would not approve the shift just because five is bigger than three. I would ask the team to resolve the margin and incrementality questions first.
That is the standard I want from groas: make the spending decision accountable to the business outcome, not the prettiest attributed ratio. Continuous execution and visible logs should serve that decision, not decorate a monthly chart that improves while the store keeps less.