

 LinkedIn
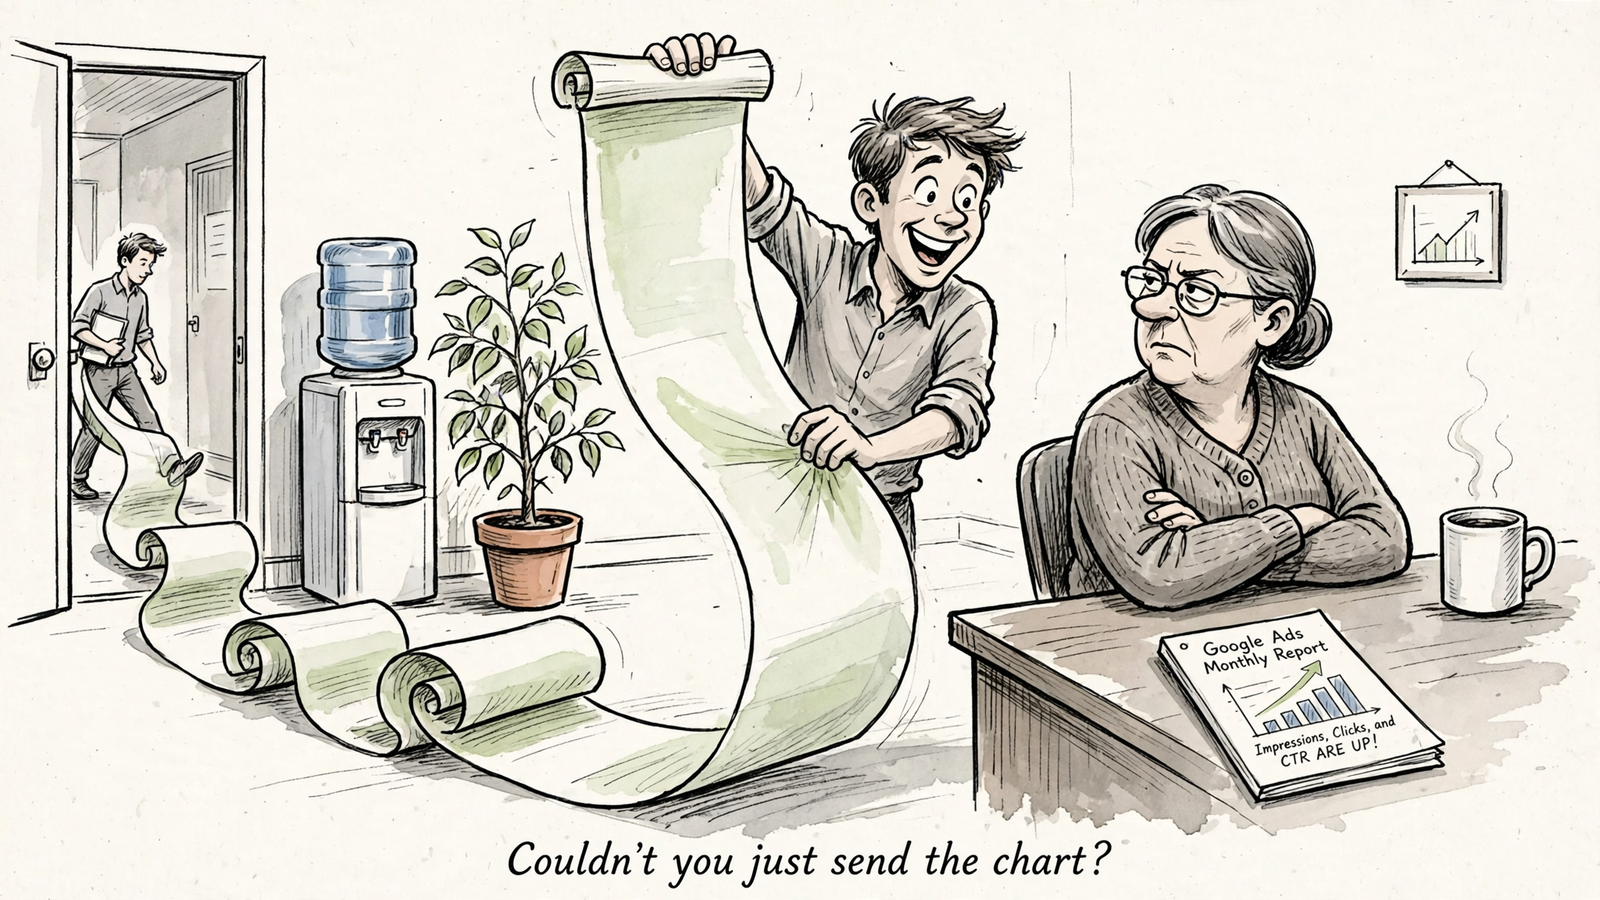
Can a Claude or ChatGPT chat reading Search Console and GA4 through groas replace a Looker Studio SEO dashboard? Smart people disagree because they are defending different jobs: finding the next fix and giving everyone the same numbers.
The dashboard camp wants a stable report, not a 40-message conversation. The chat camp wants to know why /blog fell last week, not admire the slope. Both objections deserve a proper hearing before I choose.
My test is practical: which tool gets the work done, rather than creating another reporting chore? Here is the strongest case for each, the accuracy traps neither escapes, and the setup I would actually run.
The case for dropping the dashboard: questions should not require new charts
The assistant’s strongest argument starts with a familiar waste of time. A report answers the questions someone anticipated when they built it. The next useful question usually arrives afterward.
Organic clicks fell. Fine. Which pages account for the drop? Did their positions slip, did click-through rate fall, or did demand change? Did GA4 sessions move with Search Console clicks? A dashboard can contain views for all of that. Someone still has to build them, maintain them, and follow the trail.
A Claude or ChatGPT chat connected through groas changes the starting point. I can ask the question before deciding how to display the answer. The assistant reads the connected data and works through the relevant queries, pages, and sessions without requiring another permanent tile.
The prompt I would start with is deliberately plain:
Through groas, why did organic clicks to /blog fall last week? Check Search Console, GA4, and AI referrals. Separate what the data shows from what you infer.
Then I can narrow the investigation:
- Find pages where average position slipped more than 2 spots.
- Flag URLs with 300+ impressions and a CTR below 2%.
- Check whether sessions fell with clicks or held up.
- Draft a title or intent correction for the pages worth investigating.
Those thresholds are filters, not commandments. Their value is that I can change them in the next message instead of rebuilding the report.
The argument gets stronger when diagnosis connects to action. Through groas, the same assistant can move from reading performance to drafting a correction. Where I enable execution within rules I set, the work does not have to end with a recommendation copied into another tool. Changes are logged and reversible.
That is a different job from reporting. A chart displays the drop. The assistant can investigate it and prepare the next move.
One vendor comparison frames the distinction neatly: chat wins when the question is new and no chart exists for it yet. For an operator whose week consists of those questions, a sprawling dashboard becomes overhead. I would rather spend the time checking a proposed fix than arranging another rectangle.
The case for keeping the dashboard: shared numbers need a shared home
The dashboard’s best defense has nothing to do with pretty charts. It gives everyone one stable view to open without needing me there to explain the conversation.
The boss, the client, and the content writer can follow the same link on Monday and see organic sessions down 11% last week. They can check the date range and compare it with the previous period. Nobody needs to reconstruct which question produced which answer halfway through a chat thread.
Forward a 40-message conversation instead and the reporting job lands back on the recipient. Somewhere in that thread is the answer, probably between a revised filter and a discussion about a title tag. That is not a shared report. That is homework.
This is where the same comparison gives Looker Studio the advantage for dashboards many people use. A recurring view earns its place by being predictable. Boring is useful when several people need to agree on what happened.
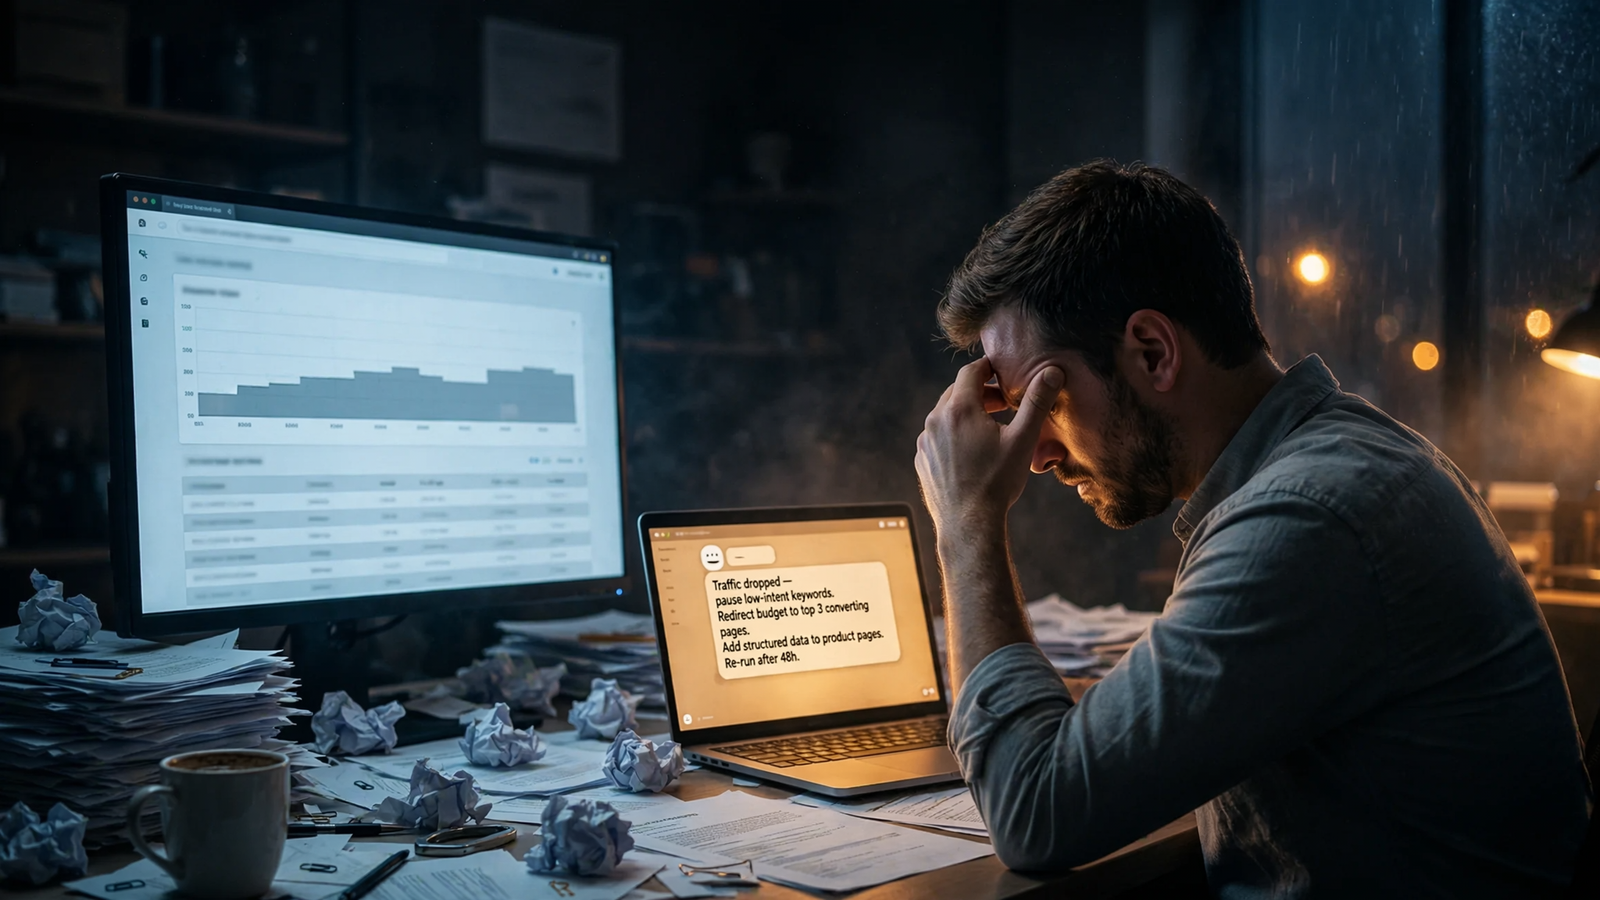
The second defense is visual memory. A trend line puts the shape of a problem in front of me before I know which question to ask. Clicks holding, impressions rising, average position falling: I can see those movements together and decide what deserves investigation.
In chat, I may first have to request the range, clarify the comparison, and ask for a chart. The dashboard already has the view waiting. For recurring comparisons and the quick is this normal or is this broken? scan, that matters.
The strongest dashboard advocate is not arguing against investigation. They are arguing against making every reader conduct one. If several people check the same trend every week, that view deserves a permanent home.
Accuracy: neither interface gets a free pass
Now I can check both arguments, including the one I prefer. An assistant that explains a number confidently has not necessarily calculated it correctly. A dashboard that renders a number neatly has not necessarily exposed its limitations.
Start with aggregation. If I hand a model a raw Search Console export and ask for account-wide CTR, averaging the row-level CTRs gives each row equal weight. That is not the same calculation as total clicks divided by total impressions. Small rows can distort the result when they count as much as large ones.
That is why the useful workflow is to aggregate the numbers first and let the model interpret the calculated result, rather than treating fluent prose as a calculator.
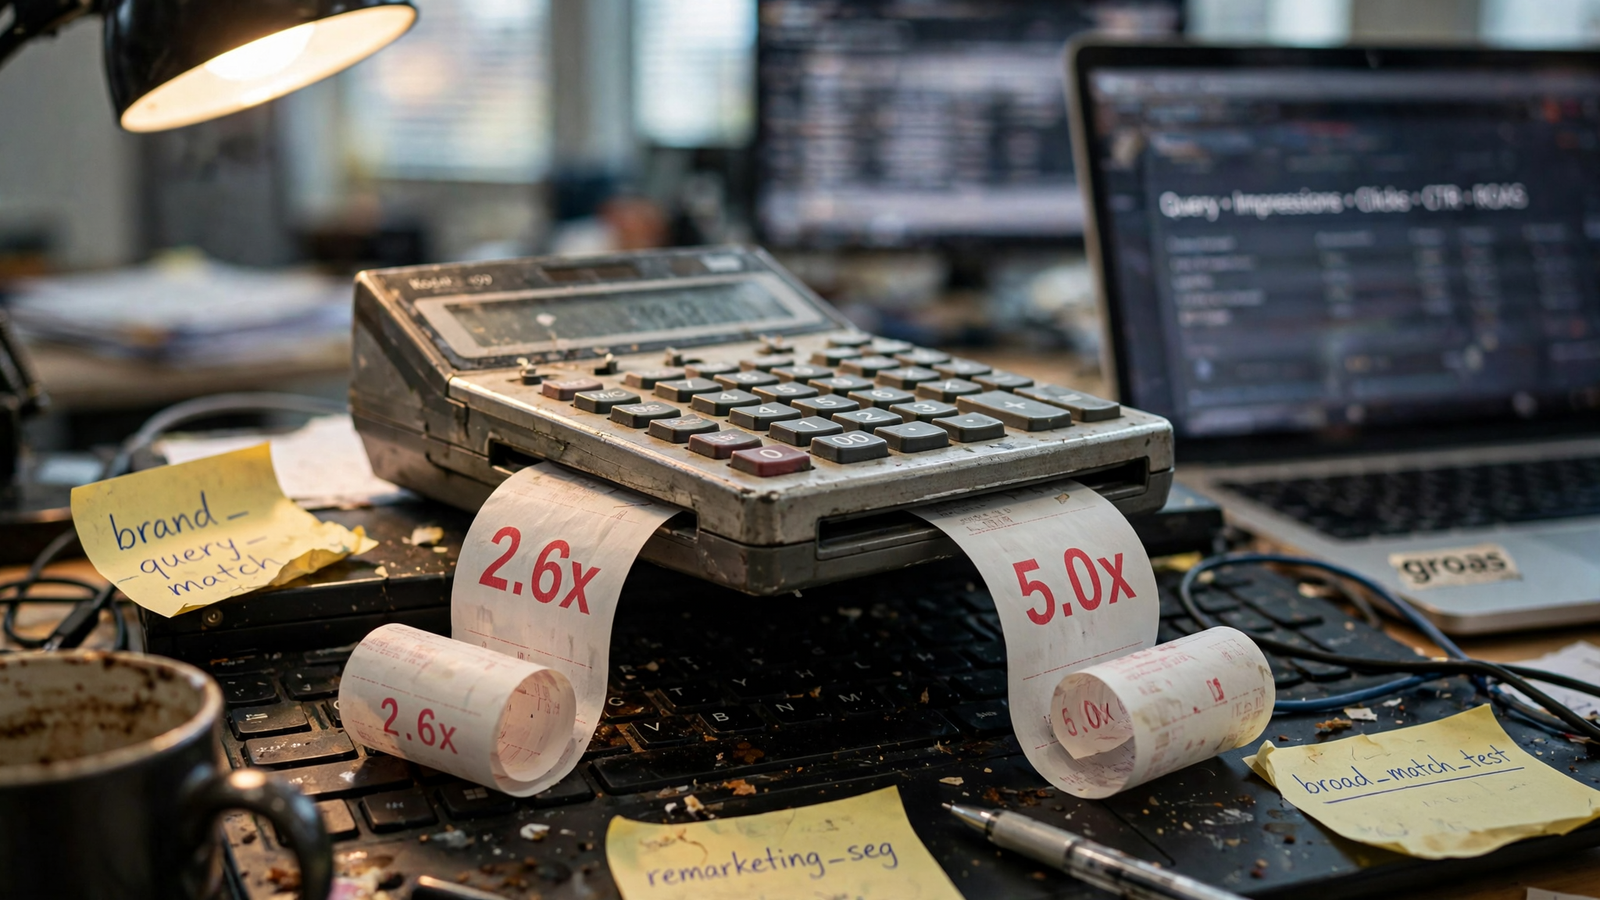
The same mistake appears in advertising reports. Datanable gives an example where total revenue divided by total spend produces 2.6x ROAS, while averaging campaign ROAS values produces 5.0x. Same underlying data. Different operation. Very different meeting.
Dashboards can hide problems more quietly. Google documents that Looker Studio can use sampled GA4 data without displaying the sampling icon. A broken chart announces itself. A loaded chart does not announce every limitation behind its number.
Then there are source constraints: Search Console delays, anonymized queries missing from tables but included in totals, and a limited history window. Those do not disappear because I replace a report with a conversation. A direct connection is not a time machine.
My rule is verify the calculation and the reporting window, not just the interface. For any blended number, I want the assistant to show:
- The sources and date ranges it used.
- The formula, including numerator and denominator.
- Whether it calculated from totals or averaged row-level ratios.
- Any known delay, missing rows, or sampling limitation affecting the comparison.
Reading connected data is preferable to asking a model to remember what was in a pasted export. It is not proof that the answer is right. I still make it show its work.
The setup I would run: one shared page, investigation in chat
I would keep one thin Looker Studio page: organic clicks and sessions by landing page, the last 28 days, nothing fancy. Its job is to let the client and content writer see the same trend without asking me for an update.
Everything beyond that has to earn its dashboard space. If I only need a view to answer one question, I would rather ask the assistant than preserve the question forever as another tab.
This division already appears in workflows that use one pipeline for ad-hoc ChatGPT questions and recurring client dashboards. It is also the practical version of replacing most Looker Studio reports with a question to an AI: remove the reporting clutter, not the shared reference point.
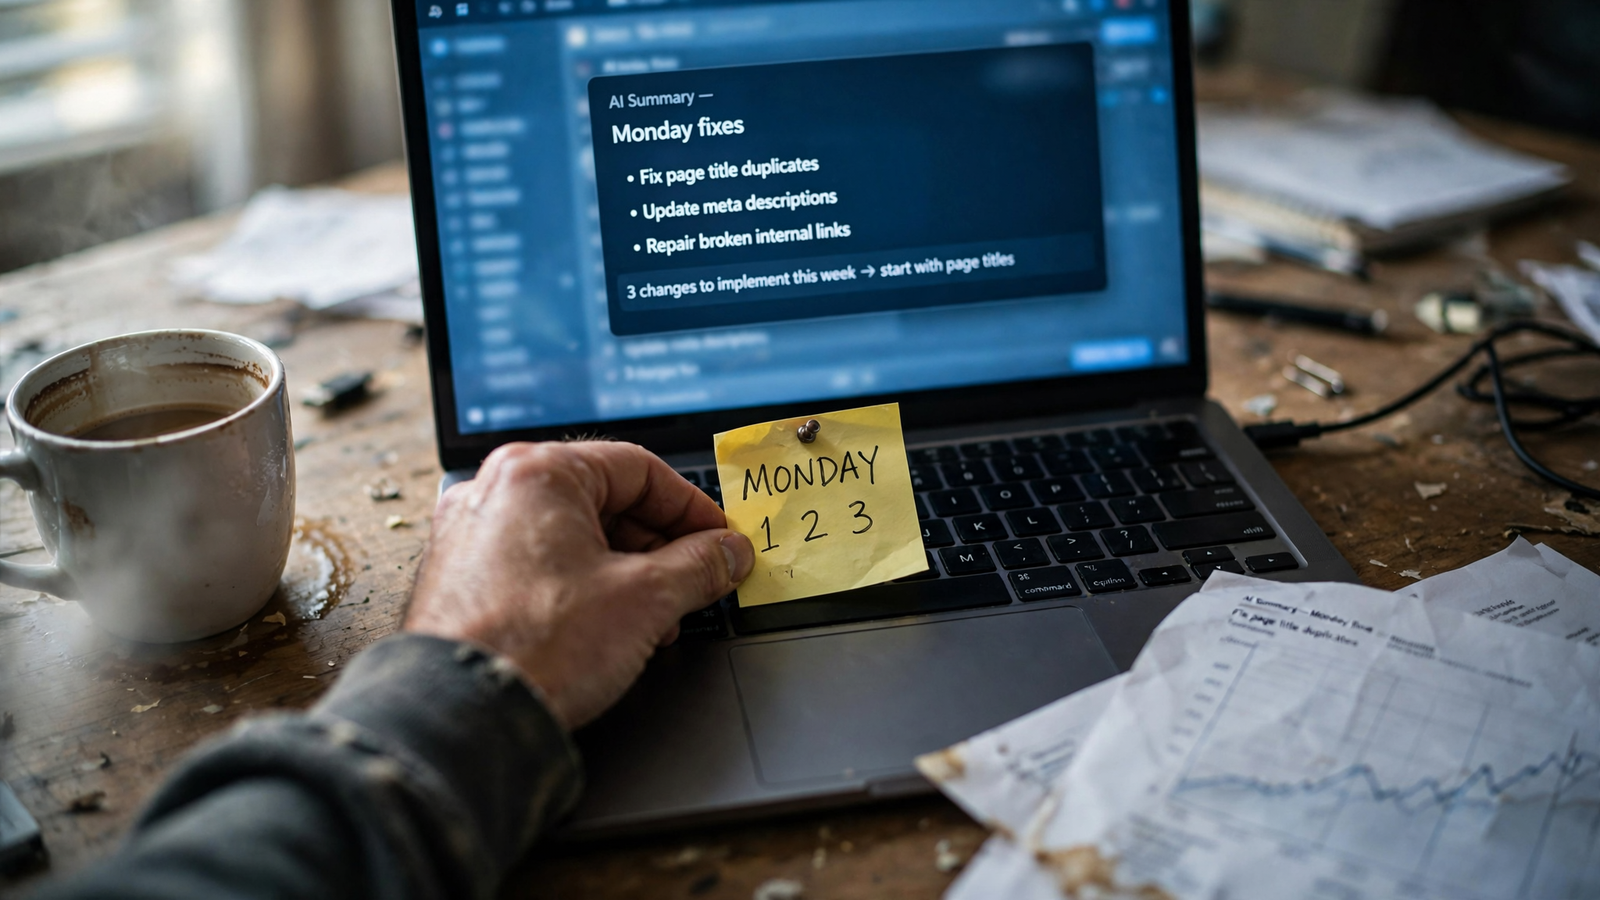
My Monday prompt would be boring on purpose:
Write the team’s SEO summary from Search Console and GA4, with three actions. Name the pages that moved, show the comparison period, and distinguish evidence from possible explanations. Draft the title or intent correction where appropriate.
The point is not to receive a longer report. It is to leave with a short list of pages worth attention and a proposed next step for each. I can challenge an explanation, request the underlying rows, or reject a weak recommendation in the same thread.
Before relying on that workflow, I would make both tools use the same definitions. Shared views need shared math more than they need shared colors.
I would pin three definitions in the chat and put them in the dashboard subtitle:
- Organic sessions: GA4 sessions classified as Organic Search using the default channel grouping.
- Clicks: Search Console clicks, not a substitute label for GA4 sessions.
- Position: Search Console average position over the selected reporting range.
Then I would make the date ranges and time-zone assumptions explicit. A Monday in one reporting setup does not automatically represent the same hours as Monday in another.
The rollout should be equally unglamorous:
- Start read-only. Connect Search Console and GA4, ask the why did it fall? questions, and change nothing.
- Reconcile the answers. Have the assistant show its formulas and investigate differences from the dashboard across three Monday checks. Agreement alone is not proof, but unexplained disagreement is a reason to stop.
- Approve drafts before execution. Check whether the proposed title or description change addresses the evidence, rather than merely sounding better.
- Enable limited execution only when ready. Keep changes inside rules I set, with a logged reason and a reversible action.
Groas autopilot stays off until I switch it on. Connecting data should not quietly become permission to edit the website.
That order matters: reconciliation first, automation second. The dashboard stays the shared receipt; chat becomes the working desk.
The limits that survive the switch
Neither side fixes the plumbing underneath. Search Console data can arrive 2 to 3 days late, so a recent drop may reflect incomplete processing rather than a performance problem. I would check completeness before asking either tool to explain a cliff.
The Search Console interface also has a 1,000-row table limit, anonymized queries, and 16 months of history. A table of query rows is not necessarily a complete accounting of the chart above it. Asking an assistant to explain the gap does not make the missing rows appear.
Time zones create another trap. Search Console uses Pacific-time days; the GA4 reporting setup may use a different time zone. Comparing identically labeled dates without checking their boundaries can turn a reporting mismatch into an imaginary performance story.
More fundamentally, Search Console clicks and GA4 sessions are different metrics. I want to understand how they move together, not force them to match because the report looks tidier that way.
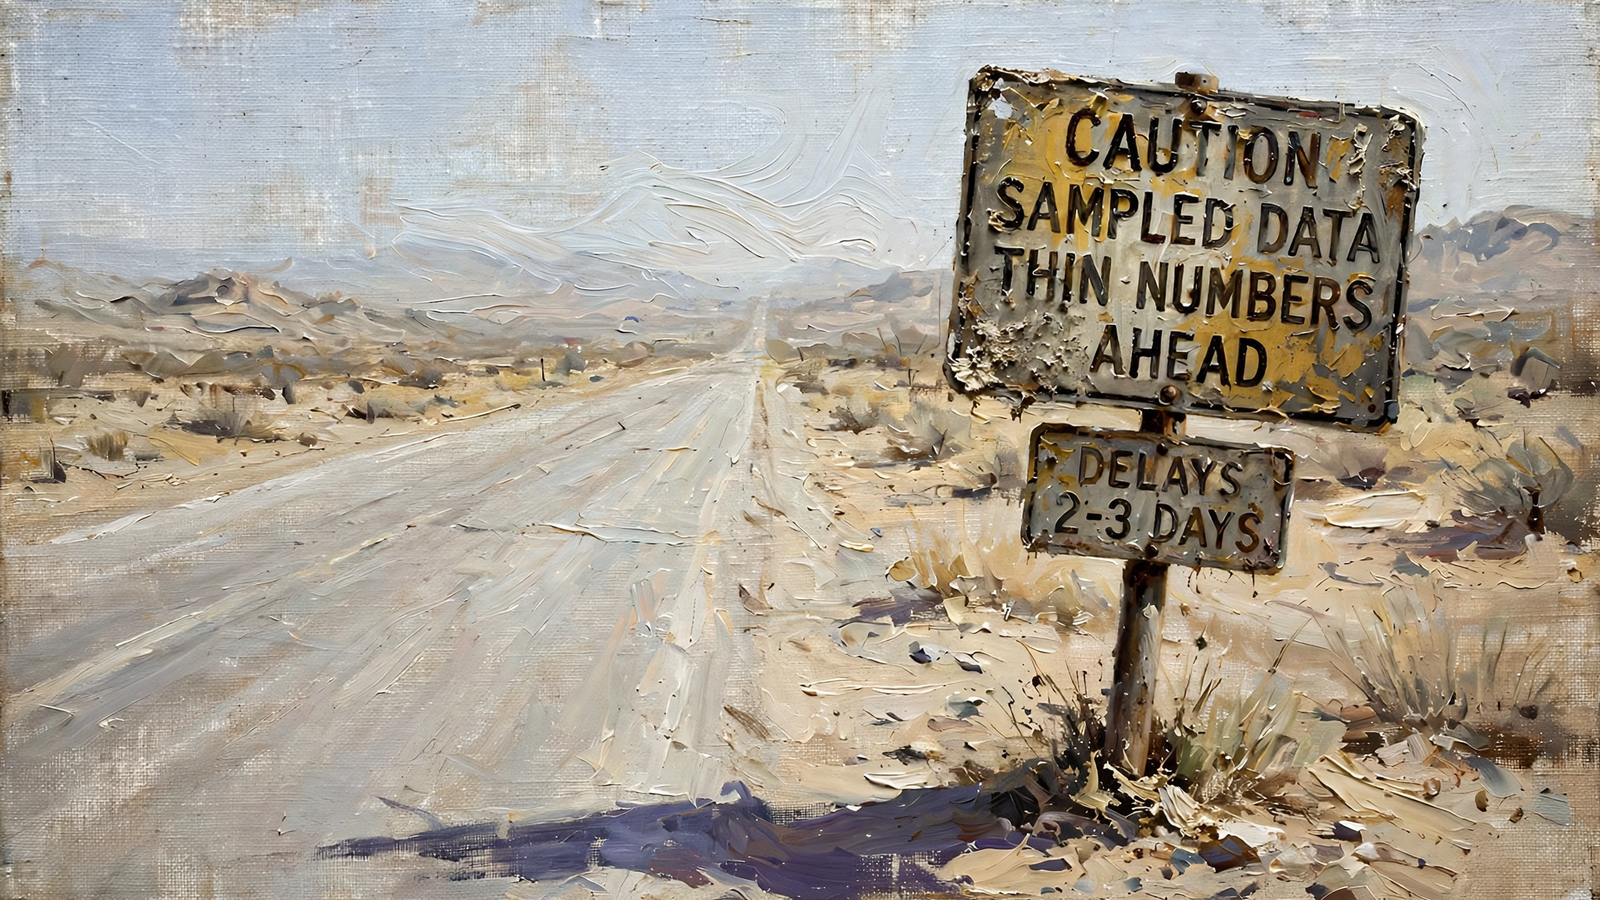
Chat also does not automatically replace a well-built recurring chart. If the question is simply whether the last 90 days look normal, I would use the existing trend view before asking the assistant to recreate it. Conversational flexibility is valuable. Repeating a solved display task is not.
And an explanation remains an explanation to test. A slipped query and a weaker title may suggest a correction; they do not establish that changing the title will recover the traffic. The assistant can shorten the path from observation to a proposed action. I still have to judge whether that action follows from the evidence.
None of this rescues the sprawling dashboard. It sets the standard the replacement must meet. I am cutting reporting waste, not outsourcing skepticism.
My verdict: replace the reporting workload, keep the shared trend
I choose the assistant as the default workspace for people who investigate SEO performance every week. I would keep one thin dashboard for the people who need to see the trend, then move diagnosis, follow-up questions, and draft corrections into Claude or ChatGPT through groas.
The single deciding consideration is the distance between noticing a problem and preparing a useful fix. The assistant can investigate the drop and draft the correction in the same workflow. The dashboard’s strongest job ends earlier: it makes the drop visible to everyone.
| Job | My choice | Why |
|---|---|---|
| Weekly stakeholder view | Dashboard | One link and a consistent reporting window |
| Trend shape at a glance | Dashboard | The recurring comparison is already visible |
| Why did /blog fall? | Assistant | Follow-up questions across queries, pages, and sessions |
| Monday summary with three actions | Assistant | Investigation leads directly to a plan and a draft correction |
I would not prescribe this switch to everyone. For a 50-page lead-generation site with one owner checking numbers monthly, I would keep the single dashboard and skip the new chat habit. There may not be enough investigative work to justify changing the workflow.
For content teams, client managers, and anyone answering why did this fall? more than twice a week, I would stop maintaining a dashboard for every question. Keep the shared trend. Move the investigation. Require formulas for blended numbers and approval before execution.
That is also how I frame the wider choice between software and a service: pay for the work the situation needs, not the ceremony around it.
My vote is not to make chat look more like a dashboard. It is to stop making a dashboard carry work it cannot finish. The dashboard keeps the receipt. The assistant does the job.


